Overview of Foreign Trade Performance
On April 15, 2025, the Ministry of Commerce and Industry published India’s official foreign trade statistics for March 2025 and the entire fiscal year spanning April 2024 to March 2025. The data indicates a slight increase in exports alongside strong inflows from the services sector but also highlights a growing merchandise trade deficit due to significant imports of oil and gold. This article explains the crucial figures, the sectors responsible for these trends, and their implications for India’s future trade prospects.
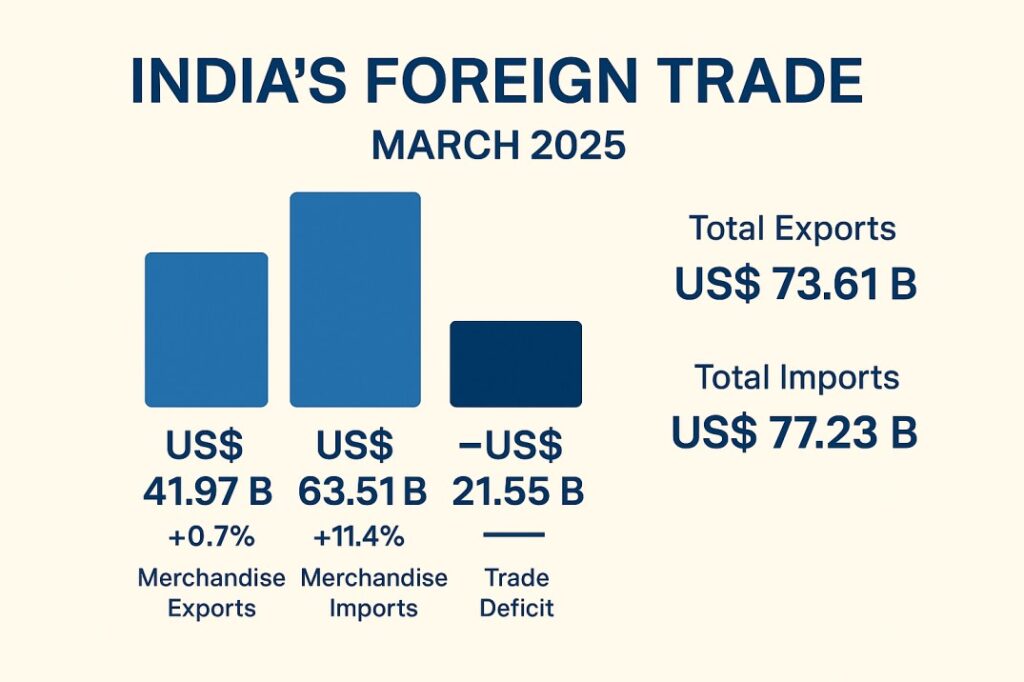
India’s total exports (merchandise and services) for FY 2024–25 reached a record US$ 820.93 billion, growing by 5.5% over the previous year, while total imports rose 6.85% to US$ 915.19 billion. The trade deficit widened to US$ 94.26 billion. March 2025 alone saw exports of US$ 73.61 billion and imports of US$ 77.23 billion.
India’s March 2025 Trade Highlights: Strong Services, Weak Goods, Soaring Imports
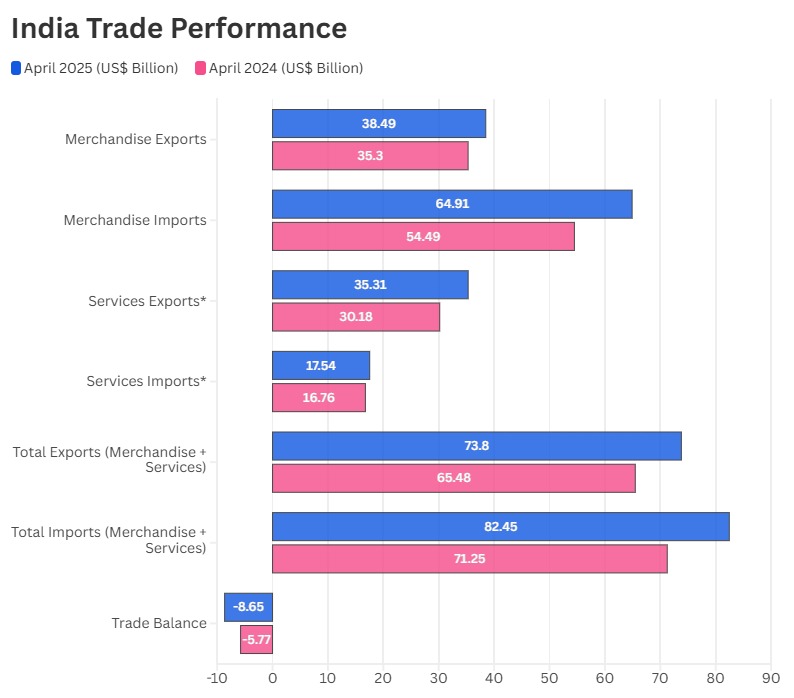
Merchandise Exports: India’s exports rose slightly by 0.7% YoY to US$ 41.97 billion in March 2025, driven by strong performance in engineering goods, rice, and pharmaceuticals, though overall momentum remained muted.
Merchandise Imports: Imports increased sharply by 11.4%, reaching US$ 63.51 billion, mainly due to higher crude oil and gold purchases, driven by both rising prices and volumes.
Services Exports and Imports: Services exports grew by 5.5% to US$ 31.64 billion, while imports dropped by 17.3% to US$ 13.73 billion, creating a strong services trade surplus that offset some of the goods trade gap.
Total Trade (Goods + Services): Combined exports rose 2.6% to US$ 73.61 billion, while imports grew 4.9% to US$ 77.23 billion, resulting in a trade deficit of US$ 3.63 billion, up from US$ 1.92 billion last year.
Key Export Contributors: Growth was supported by coffee, tobacco, electronics, rice, and pharmaceuticals, while the surge in petroleum and gold imports widened the overall deficit.
Non-Petroleum, Non-Gems & Jewellery (NP-NGJ) Trends
NP-NGJ Exports: Exports excluding oil, gems, and jewellery rose by 1.5% to US$ 34.17 billion, reflecting strength in India’s manufacturing and agriculture sectors despite a sluggish export environment.
NP-NGJ Imports: Imports in this category rose by 5.3% to US$ 37.76 billion, showing rising domestic demand for core industrial and consumer goods.
FY 2024–25 Trade Summary
Merchandise Trade: For the full fiscal year, merchandise exports were nearly flat at US$ 437.42 billion (+0.1%), while imports rose 6.2% to US$ 720.24 billion, widening the merchandise trade deficit.
Services Trade: Services exports saw strong growth of 12.5%, reaching US$ 383.51 billion, led by robust demand in IT-BPO and financial services. Imports rose 9.4% to US$ 194.95 billion.
Total Exports and Imports: Overall exports (goods + services) stood at US$ 820.93 billion, up 5.5% from the previous year. Total imports rose by 6.8% to US$ 915.19 billion.
Annual Trade Deficit: The full-year trade deficit widened to US$ 94.26 billion, compared to US$ 78.39 billion in FY 2023–24, due to a higher rise in imports than exports.
Sectoral Highlights
Several sectors led the export recovery during FY 2024–25:
- Coffee exports jumped 40.4 percent to US$ 1.81 billion.
- Tobacco shipments rose 36.5 percent to US$ 1.98 billion.
- Electronic goods exports climbed 32.5 percent to US$ 38.58 billion.
- Rice increased 19.7 percent to US$ 12.47 billion.
- Drugs & pharmaceuticals grew 9.4 percent to US$ 30.47 billion.
- Ready-made garments of all textiles expanded 10.0 percent to US$ 15.99 billion.
These high-growth segments helped offset slower performance in traditional commodities and reflect India’s push into value-added manufacturing and Agri-processing.
India’s Top Trading Partners
Top Trading Partners – March 2025 (YoY Growth)
| Exports To | Growth (%) | Imports From | Growth (%) |
|---|---|---|---|
| Kenya | +98.46% | Ireland | +208.09% |
| Australia | +70.81% | Kuwait | +93.80% |
| Togo | +46.52% | UAE | +57.25% |
| USA | +35.06% | Saudi Arabia | +44.03% |
| UK | +8.43% | China | +25.02% |
Top Trading Partners – FY 2024–25 (April–March YoY Growth)
| Exports To | Growth (%) | Imports From | Growth (%) |
|---|---|---|---|
| Japan | +21.12% | Thailand | +43.99% |
| UK | +12.08% | UAE | +32.06% |
| USA | +11.59% | China | +11.52% |
| France | +11.42% | USA | +7.44% |
| UAE | +2.84% | Russia | +4.39% |
Key Notes:
- Exports: India’s total exports (goods & services) hit a record $820.93 bn in FY 2024–25, up 5.5% from the previous year, driven by robust services and select merchandise sectors.
- Imports: Imports rose 6.85% to $915.19 bn, widening the trade deficit.
- Growth Drivers: Electronics, Agri-products (coffee, rice), and pharmaceuticals led export growth.
- Challenges: The merchandise trade deficit widened due to higher imports, especially in petroleum and gold.
- Global Context: Growth was achieved despite global headwinds like geopolitical tensions and supply chain disruptions.
Implications for Policy & Growth
- Trade Deficit Pressure: Rising oil and gold imports continue to widen India’s merchandise trade deficit. Managing energy procurement costs and improving domestic refining capacity remain priorities.
- Services Strength: A robust services surplus provides a vital cushion, underscoring the importance of IT, financial, and professional services in India’s external balance.
- Diversification & Value-Add: Growth in electronics, pharmaceuticals, and Agri-products points to successful diversification; further focus on technology, branding, and market access can bolster exports.
- Policy Focus: Continued support for export-oriented sectors, easing logistics, and negotiating favourable trade agreements will be key to sustaining momentum.
Reference Sources: Ministry of Commerce & Industry (DGCI&S), Government of India