
The Gross Goods and Services Tax (GST) collections hit a record high in April 2025 at ₹2.37 lakh crore. The Ministry of Finance has reported that the gross GST revenue for April 2025 reached ₹2,36,716 crore, representing a 12.6% increase compared to the ₹2,10,267 crore collected in April 2024.
This substantial growth indicates vigorous economic activity, enhanced compliance, and the enduring resilience of India’s consumption dynamics.
Important Key Points
- Gross GST Revenue: Total gross GST revenue for April 2025 was ₹2,36,716 crore, a 12.6% increase compared to April 2024.
- Net GST Revenue: Total net GST revenue for April 2025 was ₹2,09,376 crore, a 9.1% increase compared to April 2024.
- Domestic GST Revenue: Gross domestic GST revenue for April 2025 was ₹1,89,803 crore, a 10.7% increase compared to April 2024.
- Import GST Revenue: Gross import GST revenue for April 2025 was ₹46,913 crore, a 20.8% increase compared to April 2024.
- Refunds: Total refunds in April 2025 were ₹27,341 crore, a 48.3% increase compared to April 2024.
- State-wise Growth: State-wise GST revenue growth varied significantly, with some states showing high growth (e.g., Arunachal Pradesh at 66%) and others showing negative growth (e.g., Mizoram at -28%).
Check out the latest monthly updates on India’s GST Revenue “Goods and Services Tax (GST)“. Data is published here as soon as the govt publishes it.
The Central Board of Indirect Taxes and Customs (CBIC) has announced preliminary figures for Goods and Services Tax (GST) collections in April 2025, highlighting significant year-on-year increases in various components and regions. This report offers an insightful analysis of the overall totals, individual component distributions, and the performance of GST collections at the state level, ensuring a comprehensive understanding of the current fiscal landscape.
Aggregate GST Collections Overview
GST Revenue Summary Table (April 2025 vs April 2024)
| Category | April 2024 (₹ crore) | April 2025 (₹ crore) | Growth (%) |
|---|---|---|---|
| Gross GST Revenue | 210,267 | 236,716 | 12.6 |
| Total Refunds | 18,434 | 27,341 | 48.3 |
| Net GST Revenue | 191,833 | 209,376 | 9.1 |
Please Note:
- Gross GST comprises domestic supplies (CGST, SGST, IGST, CESS on domestic transactions) and import duties (IGST and CESS on imports).
- Refunds include domestic refunds and export-related ICEGATE refunds.
- Net GST is computed by subtracting total refunds from gross collections.
- Figures are provisional and subject to revision upon finalization.
Component-wise GST Revenue Collection Breakdown
| Component | Gross (₹ Cr) | Total Refund (₹ Cr) | Net (₹ Cr) |
|---|---|---|---|
| Central GST (CGST) | 48,634 | 3,233 | 45,401 |
| State GST (SGST) | 59,372 | 3,848 | 55,525 |
| Integrated GST (IGST) | 1,15,259 | 19,571 | 95,688 |
| Compensation Cess | 13,451 | 690 | 12,762 |
Note: that the figures presented are preliminary and might experience slight modifications upon final confirmation.
The sharpest gross growth was in IGST (15.7%), driven by both domestic and import components, while CESS collections were almost flat. Net CESS witnessed a slight contraction on account of higher refunds.
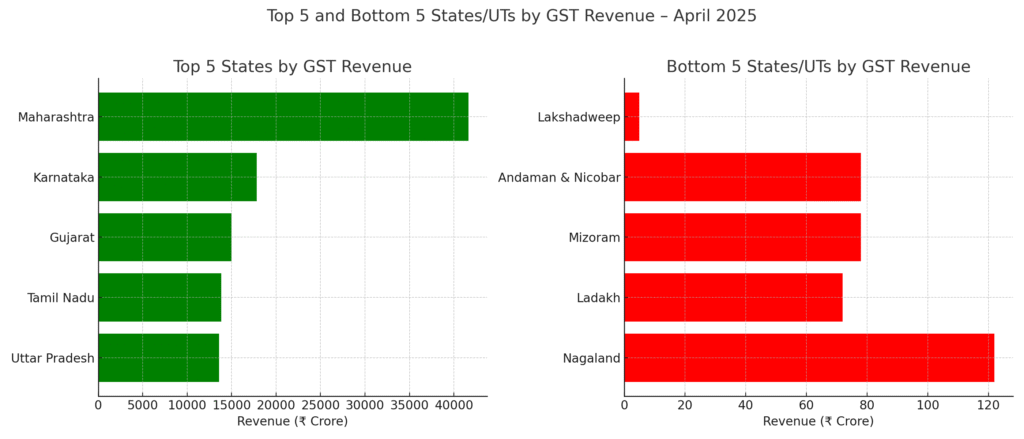
State-Wise Gross GST Revenue Collection (April 2025 vs April 2024)
Source: GST Portal, Government of India
Below mentioned table shows the full state-wise data of Gross GST Revenue for April 2025 compared to April 2024. This table lists all States and Union Territories, showing their collections and growth rates:
| Category | April 2024 (₹ crore) | April 2025 (₹ crore) | Growth (%) |
|---|---|---|---|
| Jammu and Kashmir | 789 | 880 | 12% |
| Himachal Pradesh | 1,015 | 1,094 | 8% |
| Punjab | 2,796 | 3,104 | 11% |
| Chandigarh | 313 | 334 | 7% |
| Uttarakhand | 2,239 | 2,592 | 16% |
| Haryana | 12,168 | 14,057 | 16% |
| Delhi | 7,772 | 8,260 | 6% |
| Rajasthan | 5,558 | 6,228 | 12% |
| Uttar Pradesh | 12,290 | 13,600 | 11% |
| Bihar | 1,992 | 2,290 | 15% |
| Sikkim | 403 | 470 | 17% |
| Arunachal Pradesh | 200 | 332 | 66% |
| Nagaland | 86 | 122 | 42% |
| Manipur | 104 | 121 | 16% |
| Mizoram | 108 | 78 | -28% |
| Tripura | 161 | 149 | -7% |
| Meghalaya | 234 | 350 | 50% |
| Assam | 1,895 | 2,127 | 12% |
| West Bengal | 7,293 | 8,188 | 12% |
| Jharkhand | 3,829 | 4,167 | 9% |
| Odisha | 5,902 | 6,174 | 5% |
| Chhattisgarh | 4,001 | 4,135 | 3% |
| Madhya Pradesh | 4,728 | 5,302 | 12% |
| Gujarat | 13,301 | 14,970 | 13% |
| Dadra and Nagar Haveli & Daman and Diu | 447 | 496 | 11% |
| Maharashtra | 37,671 | 41,645 | 11% |
| Goa | 765 | 806 | 5% |
| Lakshadweep | 1 | 5 | 287% |
| Kerala | 3,272 | 3,436 | 5% |
| Tamil Nadu | 12,210 | 13,831 | 13% |
| Puducherry | 247 | 266 | 8% |
| Andaman and Nicobar Islands | 65 | 78 | 21% |
| Telangana | 6,236 | 6,983 | 12% |
| Karnataka | 15,978 | 17,815 | 11% |
| Andhra Pradesh | 4,850 | 4,686 | -3% |
| Ladakh | 70 | 72 | 3% |
| Other Territory | 225 | 261 | 16% |
| Center Jurisdiction | 221 | 300 | 36% |
| Grand Total | 1,71,433 | 1,89,803 | 10.7% |
Note: This table does not include GST on the import of goods.
Key Drivers of Performance
Despite challenges like global slowdown, geopolitical instability, and trade war, GST revenues have maintained resilience, underscoring a well-functioning compliance environment and a recovering domestic economy.
Below we have mentioned a few points that may be points for this GST revenue performance.
Economic Momentum: The notable rise in Goods and Services Tax (GST) collection indicates vibrant economic activity across various industries. The significant upswing in GST revenue from imports, which is 20.8%, reflects a strong demand for goods and services, both within the country and internationally.
Compliance and Administration: An impressive increase of 48.3% in refunds compared to the previous year underscores enhanced efficiency within tax administration and quicker processing of claims. This development is beneficial for businesses as it ensures a swifter return of funds, facilitating better financial management and supporting overall business operations.
State Performance: Across various states and union territories, there was notable healthy economic development, indicating an overall recovery. Nonetheless, some areas experienced negative growth, which highlights the necessity for specific policy interventions to support and enhance economic conditions in those regions.
Policy Implications: Consistent increases in GST revenue grant the government enhanced financial flexibility to allocate funds toward infrastructure development, social welfare initiatives, and economic reforms. This steady stream of income also bolsters India’s macroeconomic stability, which is crucial amid global economic uncertainties.
The Goods and Services Tax (GST) revenue for April 2025 presents a hopeful outset for India’s new fiscal year, showcasing extensive growth across different states and sectors. Improved compliance with tax regulations suggests a promising economic outlook. Policymakers and businesses are keenly observing whether this positive trend will persist in the coming months. The strong GST collections point to an active economy reinforced by effective tax management. With continuous reforms and supportive policies, India is poised to sustain its growth trajectory throughout 2025 and beyond.