Overview of India Trade Performance
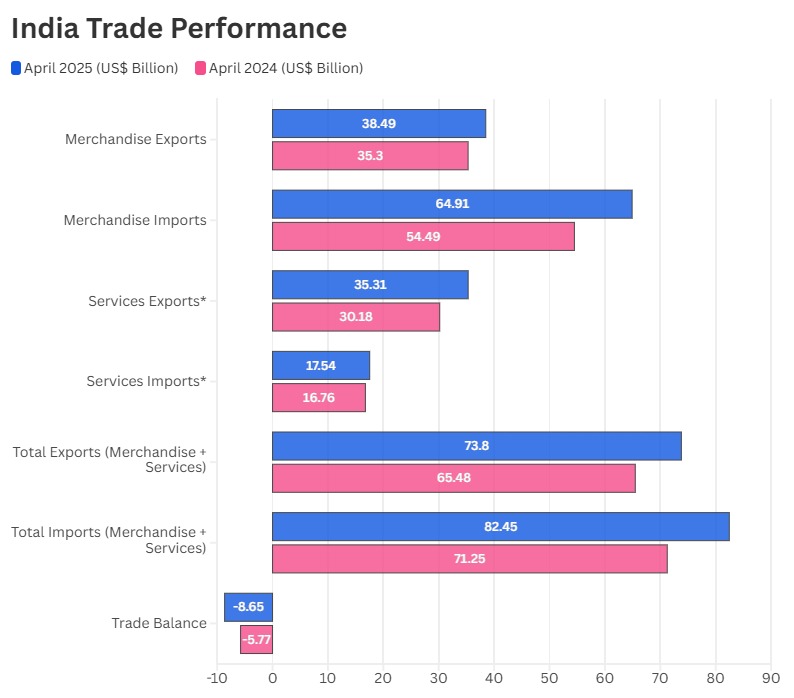
India’s external trade demonstrated notable growth in April 2025 across merchandise and services sectors. As per the recent data from the Ministry of Commerce & Industry, the combined total exports amounted to US$ 73.80 billion, achieving a 12.70% increase compared to the previous year. Meanwhile, total imports reached US$ 82.45 billion, reflecting a 15.72% rise from April 2024, resulting in a trade deficit of US$ 8.65 billion.
Important Key points
- Total Exports (Merchandise + Services) April 2025: US$ 73.80 Billion – Up from US$ 65.48 Billion in April 2024 (+12.70%)
- Total Imports (Merchandise + Services) April 2025: US$ 82.45 Billion – Up from US$ 71.25 Billion in April 2024 (+15.72%)
- Trade Deficit: US$ -8.65 Billion (widened from US$ -5.77 Billion in April 2024)
- Despite a widening trade deficit (US$ -8.65 billion), strong contributions from sectors such as electronic goods, engineering goods, textiles, and services exports helped sustain momentum.
Also Read: Foreign Trade Indicators: What’s Driving India’s Imports & Exports?
Trade during April 2025 (with YoY Growth)
| Category | April 2025 (US$ Billion) | April 2024 (US$ Billion) | YoY Growth (%) |
|---|---|---|---|
| Merchandise Exports | 38.49 | 35.30 | +9.02% |
| Merchandise Imports | 64.91 | 54.49 | +19.14% |
| Services Exports* | 35.31 | 30.18 | +17.01% |
| Services Imports* | 17.54 | 16.76 | +4.65% |
| Total Exports (Merchandise + Services) | 73.80 | 65.48 | +12.70% |
| Total Imports (Merchandise + Services) | 82.45 | 71.25 | +15.72% |
| Trade Balance | -8.65 | -5.77 | Deficit Widened |
* Note: The latest data for the services sector released by RBI is for March 2025. April 2025 data is estimated and subject to revision.
India’s Export-Import Dynamics & Sectoral Momentum
- India’s exports rose across both merchandise and services, with services exports growing faster, showcasing India’s strength in digital and professional services.
- Despite higher exports, the trade deficit expanded due to a steeper increase in import volumes and values.
- Electronics, engineering goods, textiles, and agricultural products like coffee and tea drove export growth.
- The USA, UAE, and African countries such as Kenya and Tanzania showed strong demand for Indian products.
- UAE, China, and USA were leading import sources, with Ireland registering an exceptional surge of over 425% in imports—driven likely by pharmaceuticals or tech goods.
Top Trading Partners of India– April 2025
| Exports To | Growth (%) | Imports From | Growth (%) |
|---|---|---|---|
| Kenya | +132.44% | Ireland | +425.65% |
| Tanzania | +87.20% | UAE | +88.97% |
| Australia | +74.16% | USA | +63.76% |
| UAE | +33.65% | China | +27.08% |
| USA | +27.31% | Russia | +17.82% |
Sectoral Trade Performance – April 2025
Top Export Gains vs. Top Import Declines
| Top Export Sectors | YoY Growth (%) | Declining Import Sectors | YoY Growth (%) |
|---|---|---|---|
| Tobacco | +66.43% | Pulses | -23.50% |
| Coffee | +47.85% | Newsprint | -14.40% |
| Electronic Goods | +39.51% | Coal, Coke & Briquettes | -12.28% |
| Mica, Coal & Other Minerals | +34.43% | Fruits & Vegetables | -8.97% |
| Fruits & Vegetables | +30.72% | Vegetable Oil | -8.09% |
| Marine Products | +17.81% | Leather & Leather Products | -4.84% |
| Tea | +15.93% | Transport Equipment | -3.18% |
India’s import activity in April 2025 indicates substantial economic growth and increasing involvement in global markets. Total imports, including goods and services, experienced a 15.7% year-on-year increase to USD 82.45 billion, with merchandise imports alone rising by 19.1%. This data points to strong domestic demand and engagement in international supply chains. The notable rise in non-petroleum and non-gems & jewellery imports signifies a diverse expansion beyond fluctuating commodity sectors.
Sources: Ministry of Commerce & Industry (DGCI&S), Government of India