
Important Key Points: India Labour Market Indicators – April 2025
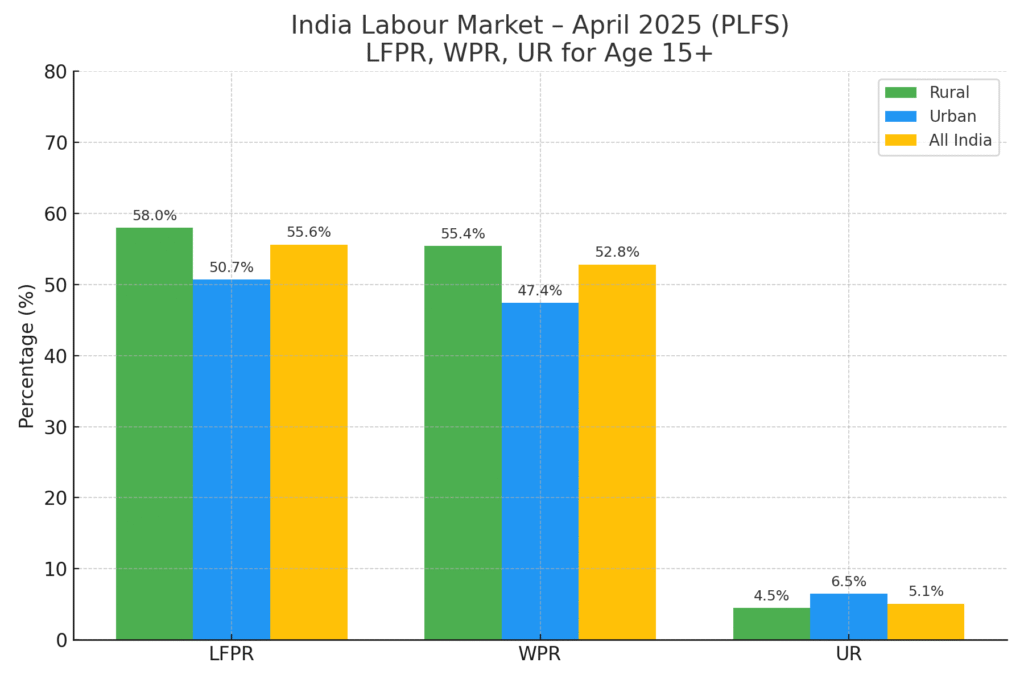
1. Labour Force Participation Rate (LFPR) – Age 15+ (CWS)
- All-India: 55.6%
- Rural: 58.0%
- Urban: 50.7%
2. Worker Population Ratio (WPR) – Age 15+ (CWS)
- All-India: 52.8%
- Rural: 55.4%
- Urban: 47.4%
3. Unemployment Rate (UR) – Age 15+ (CWS)
- All-India: 5.1%
- Rural: 4.5%
- Urban: 6.5%
These figures reflect the latest official estimates for India’s labour force participation, employment, and unemployment as of April 2025, based on the Current Weekly Status (CWS) approach.
Overview of PLFS Survey
The Periodic Labour Force Survey (PLFS) was initiated in April 2017 by the National Statistical Office (NSO) to deliver prompt and dependable estimates of employment and unemployment in India. This monthly bulletin presents essential labour market indicators:
- Labour Force Participation Rate (LFPR)
- Worker Population Ratio (WPR)
- Unemployment Rate (UR)
The data rely on the Current Weekly Status (CWS) method for individuals aged 15 and older, encompassing both rural and urban regions throughout India.
Revised Methodology (from January 2025)
The revamped Periodic Labour Force Survey (PLFS), effective January 2025, provides high-frequency labour market indicators such as – Labour Force Participation Rate (LFPR), Worker Population Ratio (WPR), and Unemployment Rate (UR)—on a monthly basis at the all-India level under Current Weekly Status (CWS). It also extends quarterly estimates to rural areas and continues annual estimates of usual status (principal + subsidiary) for both rural and urban sectors.
Because the PLFS survey method changed in January 2025: The data from April 2025 onwards cannot be directly compared with older data (from 2017 to December 2024) and This marks the start of a new data series, so people should treat it separately from previous years.
Key Labour Market Indicators – Labour Force Participation Rate (LFPR)
LFPR is the share of the population (aged 15+) either employed or actively seeking work during the reference week.
LFPR formula – (Persons working or seeking work) ÷ (Total population aged 15+) × 100
| Area | Male (%) | Female (%) | Total (%) |
|---|---|---|---|
| Rural | 79.0 | 38.2 | 58.0 |
| Urban | 75.3 | 25.7 | 50.7 |
| Combined | 77.7 | 34.2 | 55.6 |
Key Points of LFPR from the Table:
- LFPR is significantly higher in rural areas.
- The gender gap is stark—female LFPR in urban areas is just 25.7%.
- Youth (15–29) LFPR is lower than the 15+ group due to continued education.
Worker Population Ratio (WPR)
WPR is the proportion of the population (aged 15+) who worked at least 1 hour during the reference week.
WPR formula – (Persons who worked at least 1 hour in a week) ÷ (Total population aged 15+) × 100
| Area | Male (%) | Female (%) | Total (%) |
|---|---|---|---|
| Rural | 75.1 | 36.8 | 55.4 |
| Urban | 71.0 | 23.5 | 47.4 |
| Combined | 73.7 | 32.5 | 52.8 |
Key Points of WPR from the Table:
- The WPR closely follows LFPR trends.
- The rural economy supports more employment opportunities for women (though often informal).
- WPR is consistently lower for women across both regions.
Unemployment Rate (UR)
UR is the share of the population (aged 15+) who did not work at all during the reference week but were available and seeking work.
UR formula – (Persons unemployed but seeking/available for work) ÷ (Labour force) × 100
| Area | Male (%) | Female (%) | Total (%) |
|---|---|---|---|
| Rural | 4.9 | 3.9 | 4.5 |
| Urban | 5.8 | 8.7 | 6.5 |
| Combined | 5.2 | 5.0 | 5.1 |
Key Points of UR from the Table:
- UR is higher in urban areas, especially among women.
- Among youth (15–29), UR is as high as 17.2% in urban India.
- Combined UR remains stable at 5.1%, showing moderate unemployment.
Survey Coverage Sample Size (April 2025)
The increased sample size post-January 2025 enhances the reliability and granularity of monthly data.
| Area | FSUs | Households | Persons Surveyed |
|---|---|---|---|
| Rural | 4,140 | 49,323 | 2,17,483 |
| Urban | 3,371 | 40,111 | 1,63,355 |
| Total | 7,511 | 89,434 | 3,80,838 |
Reliability of Estimates – Relative Standard Error (RSE)
The reliability of the estimates of key labour market indicators is measured here by the Relative Standard Error (RSE) of the estimates.
Reliability of PLFS April 2025 Estimates (RSE – Relative Standard Error %)
| Indicator | Sector | Male (%) | Female (%) | Total (%) |
|---|---|---|---|---|
| LFPR | Rural | 0.02 | 0.07 | 0.03 |
| Urban | 0.04 | 0.12 | 0.04 | |
| WPR | Rural | 0.03 | 0.08 | 0.03 |
| Urban | 0.04 | 0.12 | 0.04 | |
| UR | Rural | 0.22 | 0.29 | 0.19 |
| Urban | 0.30 | 0.44 | 0.26 |
Key Points from the Table:
- LFPR and WPR have low RSE, making them highly reliable.
- UR has a slightly higher RSE due to a smaller base of unemployed individuals.
Points To Remember – PLFS April 2025
- More people work or look for work in rural areas, especially rural women, compared to cities.
- Unemployment is higher in urban areas, and it affects youth and women the most.
- Women are still underrepresented in the workforce, especially in urban India where fewer women are working or job hunting.
- The new monthly PLFS system gives faster updates, helping governments, researchers, and the public understand job trends more quickly.
Source: National Statistical Office (NSO), Ministry of Statistics and Programme Implementation (MoSPI)