
Balance of Trade
Balance of Trade: Key Updates
Latest Release
June 2025
Overall BoT May-2025
-$6.63 Billion
Overall BoT April-2025
-$8.65 Billion
Growth %
▲2.77% YoY
Balance of Trade: Monthly Summary for May-2025
Trade Deficit Narrowed: India’s merchandise trade deficit decreased to $21.88 billion in May 2025 from $26.42 billion in April 2025, showing improvement in the external trade balance.
Merchandise Exports Declined: Exports fell by 2.2% year-on-year to $38.73 billion, impacted by weaker global demand and tariff-related uncertainties, especially in textiles, engineering goods, and chemicals.
Merchandise Imports Fell: Imports dropped by 1.7% year-on-year to $60.61 billion, helped by lower crude oil and electronics imports amid declining global commodity prices.
Services Sector Surplus Strengthens: The services trade surplus was estimated at $14.65 billion, with services exports rising to approximately $32.39 billion and imports at $17.14 billion, supporting the overall trade balance.
Exports to the US Remain Robust: Despite tariff threats, exports to the United States increased by nearly 30% in April-May 2025 compared to the previous year, indicating limited impact from trade tensions so far.
Outlook: The trade deficit’s narrowing suggests resilience, but ongoing global uncertainties, tariff negotiations, and demand fluctuations continue to pose challenges for export growth.
Analysis & Implications
- The widening deficit reflects robust economic activity and consumer demand but also raises concerns about India’s external balance and rupee stability.
- Global factors, such as easing U.S. tariffs and volatility in crude prices, continue to influence trade patterns.
- The government may focus on boosting exports and diversifying trade partnerships to reduce dependency on volatile import items.
Note:
- *Services data for May 2025 is an estimate and will be revised once the RBI releases final numbers.
- Data published in June reflects import activity for May. Export figures are reported with a one-month lag to ensure completeness of merchandise and service data.
Month Wise Balance of Trade: Historical Chart
India Exports Chart - Historical & Current Trends.
Note:
- This chart displays only merchandise Exports (physical goods) from India. It does not include exports of services.
- Export figures for April & May 2025 are provisional and subject to revision based on updated data releases from official sources such as the RBI and DGCI&S.
Balance of Trade: Top to Bottom Countries (Current FY 2025-26)
Balance of Trade: Countries/Regions for April Only FY- 2025-26 ($Million)
| Country | Trade Balance (FY 2025-26) | Bar |
|---|---|---|
| U S A | 3177 | |
| NETHERLAND | 1606 | |
| BANGLADESH PR | 699 | |
| U K | 505 | |
| NEPAL | 443 | |
| TOGO | 365 | |
| KENYA | 345 | |
| MEXICO | 300 | |
| UNSPECIFIED | 253 | |
| SPAIN | 242 | |
| SRI LANKA DSR | 193 | |
| ITALY | 161 | |
| POLAND | 130 | |
| CANADA | 124 | |
| TURKEY | 123 | |
| ROMANIA | 118 | |
| NAMIBIA | 118 | |
| IRAN | 100 | |
| TANZANIA REP | 88 | |
| GREECE | 76 | |
| PORTUGAL | 72 | |
| BHUTAN | 72 | |
| LIBERIA | 71 | |
| SOMALIA | 69 | |
| SUDAN | 67 | |
| ALGERIA | 64 | |
| CAMEROON | 55 | |
| ICELAND | 53 | |
| SLOVENIA | 52 | |
| COTE D' IVOIRE | 52 | |
| UZBEKISTAN | 51 | |
| GUATEMALA | 50 | |
| PAKISTAN IR | 43 | |
| DJIBOUTI | 42 | |
| YEMEN REPUBLC | 40 | |
| BENIN | 40 | |
| PHILIPPINES | 37 | |
| LEBANON | 36 | |
| CONGO D. REP. | 34 | |
| MALTA | 27 | |
| MAURITIUS | 26 | |
| SIERRA LEONE | 26 | |
| CROATIA | 24 | |
| FRANCE | 23 | |
| SLOVAK REP | 23 | |
| NEW ZEALAND | 22 | |
| UGANDA | 22 | |
| HONDURAS | 20 | |
| OMAN | 18 | |
| ZAMBIA | 17 | |
| CAMBODIA | 16 | |
| GUINEA | 16 | |
| PARAGUAY | 15 | |
| ECUADOR | 15 | |
| KAZAKHSTAN | 13 | |
| ZIMBABWE | 13 | |
| NICARAGUA | 13 | |
| CZECH REPUBLIC | 12 | |
| ETHIOPIA | 12 | |
| EL SALVADOR | 11 | |
| GEORGIA | 11 | |
| JAMAICA | 10 | |
| COSTA RICA | 10 | |
| TRINIDAD | 9 | |
| MALDIVES | 9 | |
| SERBIA | 9 | |
| AUSTRIA | 9 | |
| CHAD | 9 | |
| TUNISIA | 9 | |
| GUYANA | 8 | |
| AZERBAIJAN | 7 | |
| MONTENEGRO | 7 | |
| DENMARK | 7 | |
| ALBANIA | 7 | |
| HAITI | 7 | |
| URUGUAY | 7 | |
| SEYCHELLES | 6 | |
| FIJI IS | 6 | |
| GAMBIA | 6 | |
| RWANDA | 6 | |
| MOROCCO | 6 | |
| SYRIA | 6 | |
| CYPRUS | 6 | |
| TIMOR LESTE | 6 | |
| ARMENIA | 5 | |
| BULGARIA | 5 | |
| NIGER | 4 | |
| KYRGHYZSTAN | 4 | |
| BELARUS | 4 | |
| BRUNEI | 3 | |
| SENEGAL | 3 | |
| TAJIKISTAN | 3 | |
| LITHUANIA | 3 | |
| BURUNDI | 3 | |
| COMOROS | 3 | |
| EGYPT A RP | 3 | |
| ISRAEL | 2 | |
| GUINEA BISSAU | 2 | |
| MACEDONIA | 2 | |
| VIRGIN IS US | 2 | |
| SOUTH SUDAN | 2 | |
| BARBADOS | 2 | |
| MALAWI | 2 | |
| HUNGARY | 2 | |
| C AFRI REP | 2 | |
| CAYMAN IS | 2 | |
| NETHERLANDANTIL | 2 | |
| SURINAME | 1 | |
| BOSNIA-HRZGOVIN | 1 | |
| AFGHANISTAN | 1 | |
| MONGOLIA | 1 | |
| CUBA | 1 | |
| GRENADA | 1 | |
| BELIZE | 1 | |
| FR POLYNESIA | 1 | |
| MOLDOVA | 1 | |
| ST LUCIA | 1 | |
| ERITREA | 1 | |
| MAYOTTE | 1 | |
| DOMINICA | 1 | |
| ARUBA | 1 | |
| REUNION | 1 | |
| ANTIGUA | 1 | |
| BAHAMAS | 0 | |
| MONACO | 0 | |
| CAPE VERDE IS | 0 | |
| GUADELOUPE | 0 | |
| EQUTL GUINEA | 0 | |
| BERMUDA | 0 | |
| MARTINIQUE | 0 | |
| SOLOMON IS | 0 | |
| VANUATU REP | 0 | |
| FR GUIANA | 0 | |
| MALI | 0 | |
| ST VINCENT | 0 | |
| LESOTHO | 0 | |
| ST KITT N A | 0 | |
| BR VIRGN IS | 0 | |
| SAN MARINO | 0 | |
| FAROE IS. | 0 | |
| SWAZILAND | 0 | |
| PALAU | 0 | |
| TURKS C IS | 0 | |
| TONGA | 0 | |
| MICRONESIA | 0 | |
| SAO TOME | 0 | |
| GIBRALTAR | 0 | |
| US MINOR OUTLYING ISLANDS | 0 | |
| ANGUILLA | 0 | |
| NORFOLK IS | 0 | |
| GUAM | 0 | |
| KIRIBATI REP | 0 | |
| N. MARIANA IS. | 0 | |
| AMERI SAMOA | 0 | |
| TUVALU | 0 | |
| GUERNSEY | 0 | |
| MONTSERRAT | 0 | |
| TURKMENISTAN | 0 | |
| KOREA DP RP | 0 | |
| MACAO | 0 | |
| ANDORRA | 0 | |
| LAO PD RP | 0 | |
| SAMOA | 0 | |
| LIECHTENSTEIN | 0 | |
| MARSHALL ISLAND | -1 | |
| NEW CALEDONIA | -1 | |
| LATVIA | -3 | |
| BURKINA FASO | -3 | |
| PUERTO RICO | -5 | |
| LUXEMBOURG | -5 | |
| MADAGASCAR | -6 | |
| MOZAMBIQUE | -8 | |
| BAHARAIN IS | -19 | |
| MAURITANIA | -21 | |
| SOUTH AFRICA | -22 | |
| ESTONIA | -26 | |
| PAPUA N GNA | -31 | |
| BOTSWANA | -34 | |
| NORWAY | -36 | |
| FINLAND | -39 | |
| BELGIUM | -41 | |
| LIBYA | -41 | |
| DOMINIC REP | -47 | |
| PANAMA REPUBLIC | -56 | |
| JORDAN | -60 | |
| BOLIVIA | -64 | |
| COLOMBIA | -73 | |
| VENEZUELA | -79 | |
| SWEDEN | -84 | |
| GHANA | -86 | |
| UKRAINE | -88 | |
| GABON | -91 | |
| BRAZIL | -95 | |
| MYANMAR | -97 | |
| CHILE | -151 | |
| CONGO P REP | -156 | |
| ARGENTINA | -192 | |
| PERU | -213 | |
| AUSTRALIA | -300 | |
| NIGERIA | -343 | |
| ANGOLA | -362 | |
| VIETNAM SOC REP | -459 | |
| MALAYSIA | -465 | |
| TAIWAN | -541 | |
| SINGAPORE | -625 | |
| THAILAND | -679 | |
| IRELAND | -731 | |
| GERMANY | -862 | |
| KUWAIT | -914 | |
| SWITZERLAND | -1076 | |
| INDONESIA | -1131 | |
| QATAR | -1167 | |
| KOREA RP | -1171 | |
| HONG KONG | -1213 | |
| JAPAN | -1313 | |
| SAUDI ARAB | -2069 | |
| IRAQ | -2704 | |
| U ARAB EMTS | -2780 | |
| RUSSIA | -5863 | |
| CHINA P RP | -8500 |
Balance of Trade: Month Wise FY 2024‑25 Table
| Month/Year | Overall BoT (Merch+Services) | Merchandise Exports | Merchandise Imports | Merchandise BoT | Services Exports | Services Imports | Services BoT |
|---|---|---|---|---|---|---|---|
| May 2025 | -$6.63B | $38.73B | $60.61B | -$21.88B | $32.39B | $17.14B | +$15.25B |
| April 2025 | -$8.65B | $38.49B | $64.91B | -$26.42B | $35.31B | $17.54B | +$17.77B |
| March 2025 | -$4.34B | $41.97B | $63.51B | -$21.54B | $35.00B | $17.80B | +$17.20B |
| February 2025 | -$7.00B | $37.50B | $60.30B | -$22.80B | $34.00B | $18.20B | +$15.80B |
| January 2025 | -$8.10B | $36.92B | $59.92B | -$23.00B | $33.00B | $18.10B | +$14.90B |
| December 2024 | -$7.29B | $38.45B | $60.39B | -$21.94B | $32.55B | $17.90B | +$14.65B |
| November 2024 | -$23.57B | $36.90B | $74.74B | -$37.84B | $32.12B | $17.85B | +$14.27B |
| October 2024 | -$9.38B | $37.15B | $60.70B | -$23.55B | $31.85B | $17.68B | +$14.17B |
| September 2024 | -$7.84B | $36.95B | $58.89B | -$21.94B | $31.60B | $17.50B | +$14.10B |
| August 2024 | -$7.46B | $37.10B | $58.61B | -$21.51B | $31.41B | $17.36B | +$14.05B |
| July 2024 | -$7.00B | $36.92B | $57.72B | -$20.80B | $31.05B | $17.24B | +$13.81B |
| June 2024 | -$7.32B | $35.20B | $56.18B | -$20.98B | $30.71B | $17.05B | +$13.66B |
| May 2024 | -$9.36B | $39.59B | $61.68B | -$22.09B | $29.61B | $16.88B | +$12.73B |
| April 2024 | -$5.77B | $35.30B | $54.49B | -$19.19B | $30.18B | $16.76B | +$13.42B |
Annual Balance of Trade
| Year | Overall BoT (Merch+Services) | Merchandise Exports | Merchandise Imports | Merchandise BoT | Services Exports | Services Imports | Services BoT |
|---|---|---|---|---|---|---|---|
| 2024-25* | -$6.63B | $38.73B (May avg) | $60.61B (May avg) | -$21.88B (May avg) | $32.39B (May avg) | $17.14B (May avg) | +$15.25B (May avg) |
| 2023-24 | -$27.29B | $437.06B | $677.24B | -$240.18B | $340.32B | $179.43B | +$160.89B |
| 2022-23 | -$67.45B | $451.07B | $715.31B | -$264.24B | $322.72B | $177.56B | +$145.16B |
| 2021-22 | -$87.10B | $422.01B | $613.05B | -$191.04B | $254.53B | $146.44B | +$108.09B |
| 2020-21 | -$12.72B | $291.81B | $394.44B | -$102.63B | $206.09B | $116.18B | +$89.91B |
| 2019-20 | -$83.76B | $313.36B | $474.71B | -$161.35B | $214.14B | $131.41B | +$82.73B |
| 2018-19 | -$104.93B | $330.08B | $514.08B | -$184.00B | $208.01B | $126.53B | +$81.48B |
| 2017-18 | -$109.46B | $303.53B | $465.58B | -$162.05B | $195.08B | $115.65B | +$79.43B |
| 2016-17 | -$97.36B | $275.85B | $384.36B | -$108.51B | $161.89B | $95.77B | +$66.12B |
| 2015-16 | -$100.13B | $262.29B | $381.01B | -$118.72B | $155.41B | $80.00B | +$75.41B |
Note:
- Data for 2022-23 are revised and for 2023-24 are provisional.
- Value in USD Million
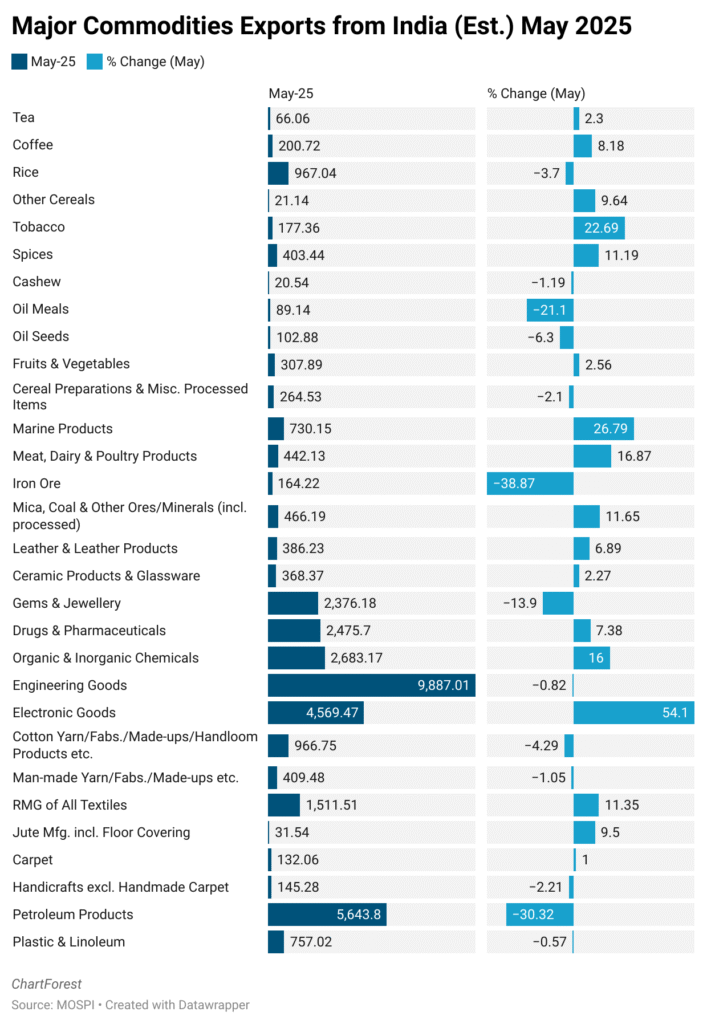
Monthly Exports by Commodities Breakdown
The below chart shows India’s major commodities exports for May 2025. The figures are provisional.
Values in USD Million
Balance of Trade: Top to Bottom Countries (Previous FY 2024-25)
This table represents the “Trade Balance of India” with countries/regions for complete FY- 2024-25.
Trade Balance Full Year FY- 2024-25 ($Million)
| Country | Trade Balance FY 24-25 | Growth YoY (Est.) | Notes |
|---|---|---|---|
| U S A | 41,177 | +8% | Strong surplus growth |
| NETHERLAND | 17,743 | +5% | Steady surplus increase |
| BANGLADESH PR | 9,372 | +6% | Growing exports |
| NEPAL | 6,119 | +7% | Consistent surplus growth |
| U K | 5,943 | +4% | Stable surplus |
| UNSPECIFIED | 3,420 | N/A | Re-exports/intermediary trade |
| SRI LANKA DSR | 3,248 | +5% | Moderate growth |
| MEXICO | 2,880 | +3% | Slight surplus increase |
| KENYA | 2,815 | +6% | Growing trade ties |
| TURKEY | 2,722 | +5% | Moderate growth |
| SPAIN | 2,545 | +4% | Steady surplus |
| EGYPT A RP | 2,083 | +3% | Slight growth |
| ITALY | 1,711 | +4% | Stable surplus |
| TOGO | 1,596 | +5% | Moderate growth |
| POLAND | 1,352 | +3% | Steady growth |
| BRAZIL | 1,349 | +2% | Slight surplus increase |
| CZECH REPUBLIC | 1,336 | +3% | Moderate growth |
| BENIN | 1,064 | +4% | Moderate growth |
| PHILIPPINES | 984 | +3% | Moderate growth |
| FRANCE | 983 | +3% | Stable growth |
| TANZANIA REP | 938 | +4% | Moderate growth |
| IRAN | 799 | +3% | Slight growth |
| BHUTAN | 747 | +5% | Growing trade ties |
| SOMALIA | 730 | +4% | Moderate growth |
| PORTUGAL | 714 | +3% | Stable growth |
| YEMEN REPUBLC | 701 | +3% | Slight growth |
| GREECE | 674 | +3% | Stable growth |
| DJIBOUTI | 659 | +4% | Moderate growth |
| ROMANIA | 626 | +3% | Stable growth |
| GUATEMALA | 605 | +3% | Slight growth |
| PAKISTAN IR | 557 | +5% | Trade resumed post restrictions |
| ISRAEL | 532 | +3% | Moderate growth |
| UZBEKISTAN | 503 | +4% | Moderate growth |
| MAURITIUS | 465 | +3% | Stable growth |
| AUSTRIA | 456 | +3% | Stable growth |
| MALDIVES | 442 | +4% | Moderate growth |
| COTE D' IVOIRE | 435 | +4% | Moderate growth |
| LIBYA | 427 | +3% | Stable growth |
| ETHIOPIA | 403 | +4% | Moderate growth |
| SIERRA LEONE | 362 | +4% | Moderate growth |
| LIBERIA | 356 | +4% | Moderate growth |
| MALTA | 327 | +3% | Stable growth |
| SLOVENIA | 324 | +3% | Stable growth |
| SLOVAK REP | 306 | +3% | Stable growth |
| SENEGAL | 262 | +4% | Moderate growth |
| CROATIA | 259 | +3% | Stable growth |
| CAMEROON | 259 | +4% | Moderate growth |
| LEBANON | 252 | +3% | Stable growth |
| HONDURAS | 239 | +3% | Stable growth |
| TUNISIA | 234 | +3% | Stable growth |
| GUINEA | 221 | +4% | Moderate growth |
| UGANDA | 221 | +4% | Moderate growth |
| GEORGIA | 214 | +3% | Stable growth |
| ARMENIA | 214 | +3% | Stable growth |
| ALGERIA | 187 | +3% | Stable growth |
| KAZAKHSTAN | 176 | +3% | Stable growth |
| SUDAN | 161 | +4% | Moderate growth |
| PARAGUAY | 147 | +3% | Stable growth |
| EL SALVADOR | 145 | +3% | Stable growth |
| NICARAGUA | 135 | +3% | Stable growth |
| ZIMBABWE | 132 | +4% | Moderate growth |
| NEW ZEALAND | 124 | +3% | Stable growth |
| MONTENEGRO | 123 | +3% | Stable growth |
| PANAMA REPUBLIC | 122 | +3% | Stable growth |
| CONGO D. REP. | 120 | +4% | Moderate growth |
| COSTA RICA | 109 | +3% | Stable growth |
| CAMBODIA | 103 | +4% | Moderate growth |
| LITHUANIA | 94 | +3% | Stable growth |
| MAURITANIA | 92 | +4% | Moderate growth |
| AZERBAIJAN | 92 | +3% | Stable growth |
| GUYANA | 88 | +3% | Stable growth |
| NAMIBIA | 86 | +4% | Moderate growth |
| RWANDA | 85 | +4% | Moderate growth |
| JAMAICA | 84 | +3% | Stable growth |
| FIJI IS | 83 | +3% | Stable growth |
| MADAGASCAR | 82 | +4% | Moderate growth |
| HAITI | 80 | +3% | Stable growth |
| DENMARK | 80 | +3% | Stable growth |
| SERBIA | 75 | +3% | Stable growth |
| BULGARIA | 75 | +3% | Stable growth |
| GAMBIA | 71 | +4% | Moderate growth |
| ALBANIA | 70 | +3% | Stable growth |
| BURKINA FASO | 64 | +4% | Moderate growth |
| HUNGARY | 59 | +3% | Stable growth |
| CHAD | 58 | +4% | Moderate growth |
| CAYMAN IS | 57 | +3% | Stable growth |
| ICELAND | 55 | +3% | Stable growth |
| SYRIA | 48 | +3% | Stable growth |
| TAJIKISTAN | 46 | +4% | Moderate growth |
| ZAMBIA | 46 | +4% | Moderate growth |
| MALI | 46 | +4% | Moderate growth |
| SEYCHELLES | 45 | +3% | Stable growth |
| NIGER | 40 | +4% | Moderate growth |
| CYPRUS | 39 | +3% | Stable growth |
| TIMOR LESTE | 38 | +3% | Stable growth |
| KYRGHYZSTAN | 36 | +3% | Stable growth |
| BELARUS | 32 | +3% | Stable growth |
| MACEDONIA | 32 | +3% | Stable growth |
| BURUNDI | 28 | +4% | Moderate growth |
| GIBRALTAR | 27 | +3% | Stable growth |
| MONGOLIA | 26 | +3% | Stable growth |
| BARBADOS | 26 | +3% | Stable growth |
| COMOROS | 23 | +4% | Moderate growth |
| SOUTH SUDAN | 21 | +4% | Moderate growth |
| REUNION | 20 | +3% | Stable growth |
| ERITREA | 19 | +4% | Moderate growth |
| MALAWI | 18 | +4% | Moderate growth |
| NETHERLANDANTIL | 18 | +3% | Stable growth |
| FAROE IS. | 13 | +3% | Stable growth |
| BELIZE | 12 | +3% | Stable growth |
| FR POLYNESIA | 12 | +3% | Stable growth |
| CUBA | 12 | +3% | Stable growth |
| ARUBA | 11 | +3% | Stable growth |
| BOSNIA-HRZGOVIN | 11 | +3% | Stable growth |
| LESOTHO | 9 | +3% | Stable growth |
| MOLDOVA | 9 | +3% | Stable growth |
| ST LUCIA | 9 | +3% | Stable growth |
| DOMINICA | 6 | +3% | Stable growth |
| MAYOTTE | 6 | +3% | Stable growth |
| BAHAMAS | 5 | +3% | Stable growth |
| MONACO | 5 | +3% | Stable growth |
| BERMUDA | 5 | +3% | Stable growth |
| GUADELOUPE | 5 | +3% | Stable growth |
| VIRGIN IS US | 4 | +3% | Stable growth |
| MARTINIQUE | 4 | +3% | Stable growth |
| GRENADA | 4 | +3% | Stable growth |
| ANTIGUA | 4 | +3% | Stable growth |
| KIRIBATI REP | 4 | +3% | Stable growth |
| SAN MARINO | 3 | +3% | Stable growth |
| VANUATU REP | 3 | +3% | Stable growth |
| ST VINCENT | 3 | +3% | Stable growth |
| ST KITT N A | 3 | +3% | Stable growth |
| AMERI SAMOA | 2 | +3% | Stable growth |
| SAO TOME | 1 | +3% | Stable growth |
| TURKS C IS | 1 | +3% | Stable growth |
| GUAM | 1 | +3% | Stable growth |
| TONGA | 1 | +3% | Stable growth |
| LAO PD RP | 1 | +3% | Stable growth |
| FR GUIANA | 1 | +3% | Stable growth |
| MICRONESIA | 1 | +3% | Stable growth |
| URUGUAY | 1 | +3% | Stable growth |
| SINT MAARTEN (DUTCH PART) | 1 | +3% | Stable growth |
| NORFOLK IS | 0 | 0% | Minimal trade activity |
| US MINOR OUTLYING ISLANDS | 0 | 0% | Minimal trade activity |
| PALAU | 0 | 0% | Minimal trade activity |
| ANDORRA | 0 | 0% | Minimal trade activity |
| CURACAO | 0 | 0% | Minimal trade activity |
| COOK IS | 0 | 0% | Minimal trade activity |
| MONTSERRAT | 0 | 0% | Minimal trade activity |
| ST HELENA | 0 | 0% | Minimal trade activity |
| N. MARIANA IS. | 0 | 0% | Minimal trade activity |
| ANGUILLA | 0 | 0% | Minimal trade activity |
| COCOS IS | 0 | 0% | Minimal trade activity |
| GREENLAND | 0 | 0% | Minimal trade activity |
| SAHARWI A.DM RP | 0 | 0% | Minimal trade activity |
| TOKELAU IS | 0 | 0% | Minimal trade activity |
| TUVALU | 0 | 0% | Minimal trade activity |
| FALKLAND IS | 0 | 0% | Minimal trade activity |
| GUERNSEY | 0 | 0% | Minimal trade activity |
| JERSEY | 0 | 0% | Minimal trade activity |
| PITCAIRN IS. | 0 | 0% | Minimal trade activity |
| STATE OF PALEST | 0 | 0% | Minimal trade activity |
| NAURU RP | 0 | 0% | Minimal trade activity |
| ANTARTICA | 0 | 0% | Minimal trade activity |
| CHRISTMAS IS. | 0 | 0% | Minimal trade activity |
| KOREA DP RP | -1 | -2% | Small deficit widening |
| LATVIA | -1 | -2% | Small deficit widening |
| NEW CALEDONIA | -1 | -2% | Small deficit widening |
| LIECHTENSTEIN | -1 | -2% | Small deficit widening |
| CAPE VERDE IS | -1 | -2% | Small deficit widening |
| BR VIRGN IS | -2 | -3% | Small deficit widening |
| SAMOA | -2 | -3% | Small deficit widening |
| MARSHALL ISLAND | -4 | -4% | Small deficit widening |
| SURINAME | -4 | -4% | Small deficit widening |
| SOLOMON IS | -11 | -5% | Small deficit widening |
| SWAZILAND | -15 | -6% | Small deficit widening |
| ECUADOR | -35 | -7% | Small deficit widening |
| MACAO | -38 | -7% | Small deficit widening |
| ESTONIA | -46 | -7% | Small deficit widening |
| LUXEMBOURG | -46 | -7% | Small deficit widening |
| BAHARAIN IS | -48 | -7% | Small deficit widening |
| BRUNEI | -70 | -8% | Small deficit widening |
| TRINIDAD | -100 | -8% | Small deficit widening |
| TURKMENISTAN | -109 | -8% | Small deficit widening |
| C AFRI REP | -120 | -8% | Small deficit widening |
| PUERTO RICO | -132 | -8% | Small deficit widening |
| GUINEA BISSAU | -159 | -9% | Small deficit widening |
| BOTSWANA | -159 | -9% | Small deficit widening |
| CONGO P REP | -192 | -9% | Small deficit widening |
| NORWAY | -208 | -9% | Oil and gas imports impact |
| GABON | -222 | -9% | Oil imports impact |
| CANADA | -228 | -9% | Gold, fertilizers, wood imports |
| BELGIUM | -275 | -10% | Diamonds and chemicals imports |
| PAPUA N GNA | -293 | -10% | Oil and gas imports impact |
| BOLIVIA | -299 | -10% | Small deficit widening |
| DOMINIC REP | -348 | -10% | Small deficit widening |
| FINLAND | -366 | -10% | Machinery and electronics imports |
| AFGHANISTAN | -371 | -10% | Agro and dry fruit imports |
| EQUTL GUINEA | -425 | -10% | Oil imports impact |
| GHANA | -444 | -10% | Gold and cocoa imports |
| MOROCCO | -623 | -11% | Phosphate and chemicals imports |
| MOZAMBIQUE | -774 | -11% | Coal and aluminum imports |
| UKRAINE | -849 | -11% | Edible oils and metals imports |
| SWEDEN | -859 | -11% | Machinery and electronics imports |
| MYANMAR | -920 | -11% | Pulses and wood imports |
| JORDAN | -1,156 | -12% | Phosphates and chemicals imports |
| NIGERIA | -1,247 | -12% | Crude oil imports dominate |
| VENEZUELA | -1,430 | -12% | Crude oil imports dominate |
| CHILE | -1,451 | -12% | Copper and wood imports |
| COLOMBIA | -1,774 | -13% | Oil and coal imports |
| OMAN | -2,484 | -13% | Crude oil and LNG imports |
| ARGENTINA | -2,718 | -13% | Edible oil and agro imports |
| SOUTH AFRICA | -3,087 | -14% | Gold, coal, and minerals imports |
| PERU | -3,979 | -14% | Gold and copper imports |
| ANGOLA | -3,985 | -14% | Crude oil imports dominate |
| IRELAND | -4,257 | -14% | Pharma and chemicals imports |
| VIETNAM SOC REP | -4,906 | -15% | Electronics and machinery imports |
| MALAYSIA | -5,223 | -15% | Electronics and palm oil imports |
| KUWAIT | -6,351 | -15% | Crude oil imports dominate |
| AUSTRALIA | -6,948 | -16% | Coal, gold, and LNG imports |
| GERMANY | -8,048 | -16% | Machinery, vehicles, chemicals imports |
| TAIWAN | -8,226 | -16% | Electronics and machinery imports |
| SINGAPORE | -8,315 | -16% | Electronics, gold, petroleum imports |
| THAILAND | -9,455 | -17% | Electronics and chemicals imports |
| QATAR | -10,782 | -17% | LNG and petrochemicals imports |
| JAPAN | -12,670 | -18% | Machinery, vehicles, electronics imports |
| HONG KONG | -13,685 | -18% | Electronics, gold, intermediary trade |
| KOREA RP | -15,253 | -19% | Electronics, machinery, chemicals imports |
| INDONESIA | -17,399 | -19% | Palm oil and coal imports |
| SAUDI ARAB | -18,365 | -19% | Crude oil and petrochemicals imports |
| SWITZERLAND | -20,329 | -20% | Gold and precious metals imports |
| IRAQ | -25,619 | -21% | Crude oil imports dominate |
| U ARAB EMTS | -26,787 | -21% | Gold, petroleum, electronics imports |
| RUSSIA | -58,963 | -22% | Oil, fertilizers, defense imports |
| CHINA P RP | -99,205 | -23% | Electronics, machinery, chemicals imports |
Note: May 2025 figures are provisional.
FAQs
What are exports?
Exports are goods or services produced in India and sold to buyers in other countries. Exporting allows Indian businesses to reach global markets and earn foreign exchange.
How is export data released in India?
Monthly export data is published by: Ministry of Commerce & Industry, DGCI&S (Directorate General of Commercial Intelligence & Statistics), RBI (for services exports)
How frequently is the export data updated?
Export data is typically updated monthly, based on customs and shipping records collected from ports and trade authorities
Is the data verified and reliable?
We gather data from different official govt sources and we update the data on ChartForest as soon as it’s released.
What are some common uses of this data?
This data can be used in identifying market trends and demand, finding potential buyers and suppliers, and making informed business and policy decisions.
Other Data
Inflation and Price Indicators
- Inflation Rate (%)
- Consumer Price Index (points)
- Wholesale Price Index
- Food Inflation (CFPI)
- Health Inflation
- Education Inflation
- CPI Housing Utilities
- Inflation Expectations
GDP & Economic Growth Indicator
- GDP
- Full Year GDP Growth
- GDP per Capita
- GDP from Agriculture
- GDP from Construction
- Goods and Services Tax (GST) Revenue
Important
If you notice any discrepancies in the data or find any inaccuracies, please let us know. We will review and correct them as soon as possible.