
India GDP Growth Rate
India GDP Growth Rate: Key Updates
Latest Release
May, 2025
Quarterly GDP–Q4(2024–25)
7.4%
Quarterly GDP–Q3(2024–25)
6.4%
Quarterly GDP Summary – Q4 FY 2024–25 (Jan–Mar)
Quarterly Real GDP (Constant 2011-12 Prices):
- Q4 2024-25: ₹51.35 lakh crore ($619 billion)
- Q4 2023-24: ₹47.82 lakh crore ($576 billion)
- Growth rate: 7.4% year-on-year
India’s real GDP for Q4 is estimated at ₹51.35 lakh crore (approx. $619 billion), showing a 7.4% year-on-year growth. This reflects solid economic activity after adjusting for inflation.
Quarterly Nominal GDP (Current Prices):
- Q4 2024-25: ₹88.18 lakh crore ($1,062 billion)
- Q4 2023-24: ₹79.61 lakh crore ($959 billion)
- Growth rate: 10.8% year-on-year
At current market prices, India’s GDP stands at ₹88.18 lakh crore (approx. $1.06 trillion), indicating a 10.8% growth from the previous year. This includes the effects of both real growth and inflation.
Quarterly Sectoral Highlights:
- Construction sector: 10.8% growth in Q4 2024-25
- Public Administration, Defence & Other Services: 8.7% growth
- Financial, Real Estate & Professional Services: 7.8% growth
- Primary Sector: 5.0% growth (compared to 0.8% in Q4 last year)
India’s Annual GDP Summary Estimates (2024–25)
Annual GDP Growth Rate
6.5%
Annual Real GDP
₹187.97 lakh cr OR $2.26 Trillion
Annual Nominal GDP
₹330.68 lakh cr OR $3.98 Trillion
Annual Real GDP (Constant 2011-12 Prices):
- 2024-25: ₹187.97 lakh crore ($2.26 trillion)
- 2023-24: ₹176.51 lakh crore ($2.13 trillion)
- Growth rate: 6.5%
India’s real (inflation-adjusted) GDP for FY 2024–25 is estimated at ₹187.97 lakh crore (approx. $2.26 trillion), showing a 6.5% increase over FY 2023–24. This indicates a stable and strong economic expansion in real terms.
Annual Nominal GDP (Current Prices):
- 2024-25: ₹330.68 lakh crore ($3.98 trillion)
- 2023-24: ₹301.23 lakh crore ($3.63 trillion)
- Growth rate: 9.8%
At current market prices, India’s GDP reached ₹330.68 lakh crore (approx. $3.98 trillion) in FY 2024–25, registering a 9.8% growth. This includes both increased production and the effects of price levels (inflation).
Annual Sectoral Highlights:
- Primary Sector (Agriculture, Forestry, Fishing, Mining): Grew by 4.4%, a strong rise from 2.7% the previous year, driven mainly by better agricultural output.
- Secondary Sector (Manufacturing, Utilities, Construction): Expanded by 6.1%, reflecting improved industrial activity. Within this:
- Manufacturing: Grew 4.5%
- Construction: Surged 9.4%, the fastest-growing sub-sector.
- Tertiary Sector (Services): Recorded 7.2% growth, driven by steady performance in:
- Financial, Real Estate & Professional Services: 7.2%
- Public Administration, Defence & Other Services: 8.9%
India's Quarterly GDP Growth Rate Chart
India GDP Growth Rate Chart - Historical & Current Trends
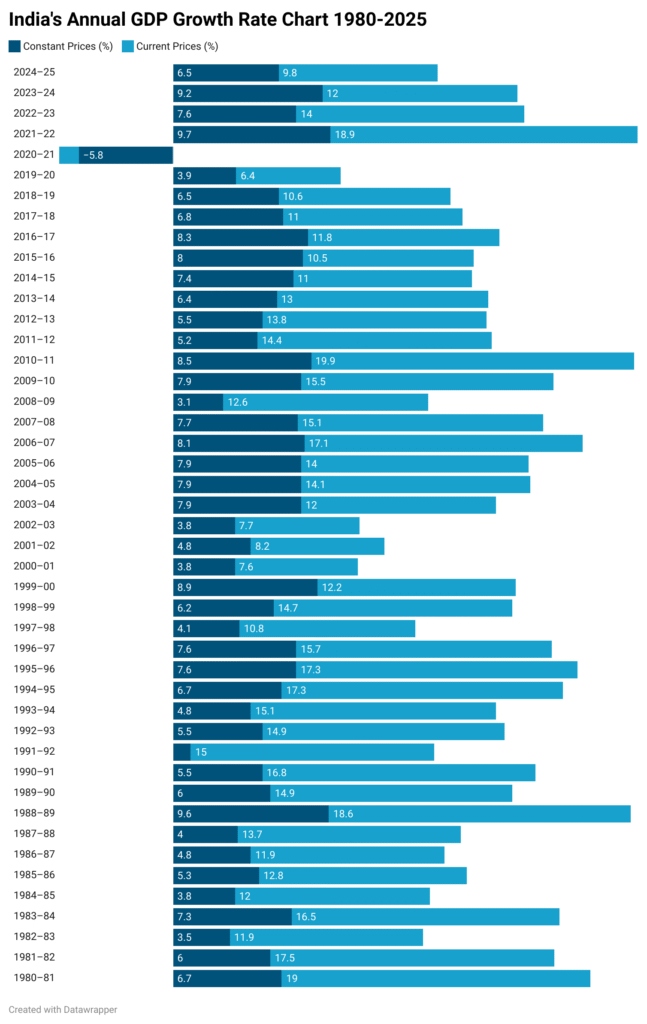
India's Annual GDP Growth Rate Chart
FAQs
What is GDP?
Gross Domestic Product (GDP) is the total monetary value of all goods and services produced within a country’s borders in a specific period (usually a year or a quarter). It is the most widely used indicator to measure the size and health of an economy.
What is the difference between Real GDP and Nominal GDP?
Real GDP is adjusted for inflation and reflects the actual volume of production. It helps track economic growth over time in constant prices (base year: 2011–12 in India). Nominal GDP includes the effects of inflation and is measured at current market prices.
What does GDP growth rate mean?
GDP growth rate is the percentage increase or decrease in GDP over a given period, usually compared year-on-year (YoY) or quarter-on-quarter (QoQ). A higher growth rate generally signals a healthier, expanding economy.
How often is India’s GDP data released?
Quarterly GDP is released four times a year (May, August, November, and February). Annual GDP is published in advance estimates (Jan), second estimates (Feb), and provisional estimates (May) each fiscal year.
How is the GDP data on this page updated?
We update the GDP figures using the official data released by the Government of India, primarily sourced from the National Statistics Office (NSO), Ministry of Statistics and Programme Implementation (MoSPI). Data is updated immediately after official press releases.
Related Indicators
- GDP
- Full Year GDP Growth
- GDP per Capita
- GDP from Agriculture
- GDP from Construction
- Goods and Services Tax (GST) Revenue
Important
If you notice any discrepancies in the data or find any inaccuracies, please let us know. We will review and correct them as soon as possible.
Other Indicators
Monetary Policy & Banking Indicators
Inflation and Price Indicators
- Inflation Rate
- Consumer Price Index
- Wholesale Price Index
- Food Inflation (CFPI)
- Health Inflation
- Education Inflation
- CPI Housing Utilities
- Inflation Expectations