India GDP/GVA from Agriculture, Forestry and Fishing
GDP/GVA from Agriculture, Forestry & Fishing: Key Updates
Latest Release
Q2, 2025-26
Constant Prices
₹4.93 lakh crore (3.5% YoY growth)
Current Prices
₹10.56 lakh crore (1.8% YoY growth)
Quarterly GVA – Agriculture, Forestry & Fishing Summary (Q2 FY 2025–26)
Real GVA: Agriculture, Forestry, and Fishing Output (Constant 2011–12 Prices)
- Q2 2025–26: ₹4.93 lakh crore (₹4,92,623 crore)
- Q2 2024–25: ₹4.76 lakh crore (₹4,75,765 crore)
- Growth Rate: 3.5% YoY
Key Takeaway: Agriculture, Forestry & Fishing grew 3.5% in real terms during Q2 FY 2025–26, slightly moderating from last year’s 4.1%. Despite uneven monsoon patterns, the sector maintained stable momentum supported by steady foodgrain, horticulture, and livestock output.
Nominal GVA: Agriculture, Forestry, and Fishing Output (Current Prices)
- Q2 2025–26: ₹10.56 lakh crore (₹10,55,598 crore)
- Q2 2024–25: ₹10.37 lakh crore (₹10,37,227 crore)
- Growth Rate: 1.8% YoY
Key Takeaway: Nominal GVA growth slowed to 1.8%, reflecting lower food price inflation (CPI food inflation was subdued during the quarter), which reduced the price-led contribution to nominal value.
Real GVA Quarter-wise Trend (YoY Growth)
- Q2 FY 2025–26: 3.5%
- Q2 FY 2024–25: 4.1%
Key Takeaway: Agriculture continues to deliver stable, moderate growth, maintaining its role as a resilience pillar for the economy.
Key Drivers Behind Growth
- Steady foodgrain production (First Advance Estimates)
- Strong horticulture output
- Growth in livestock products and fisheries
- Moderation in food inflation, supporting real purchasing power
- Stable demand from rural and semi-urban regions
Quarter-wise GVA from Agri, Forestry & Fishing: Historical Chart
India's GVA from Agriculture, Forestry and Fishing Chart - Historical & Current Trends
Annual GVA from Agri, Forestry and Fishing
Annual GVA Agriculture, Forestry and Fishing Summary (2024–25)
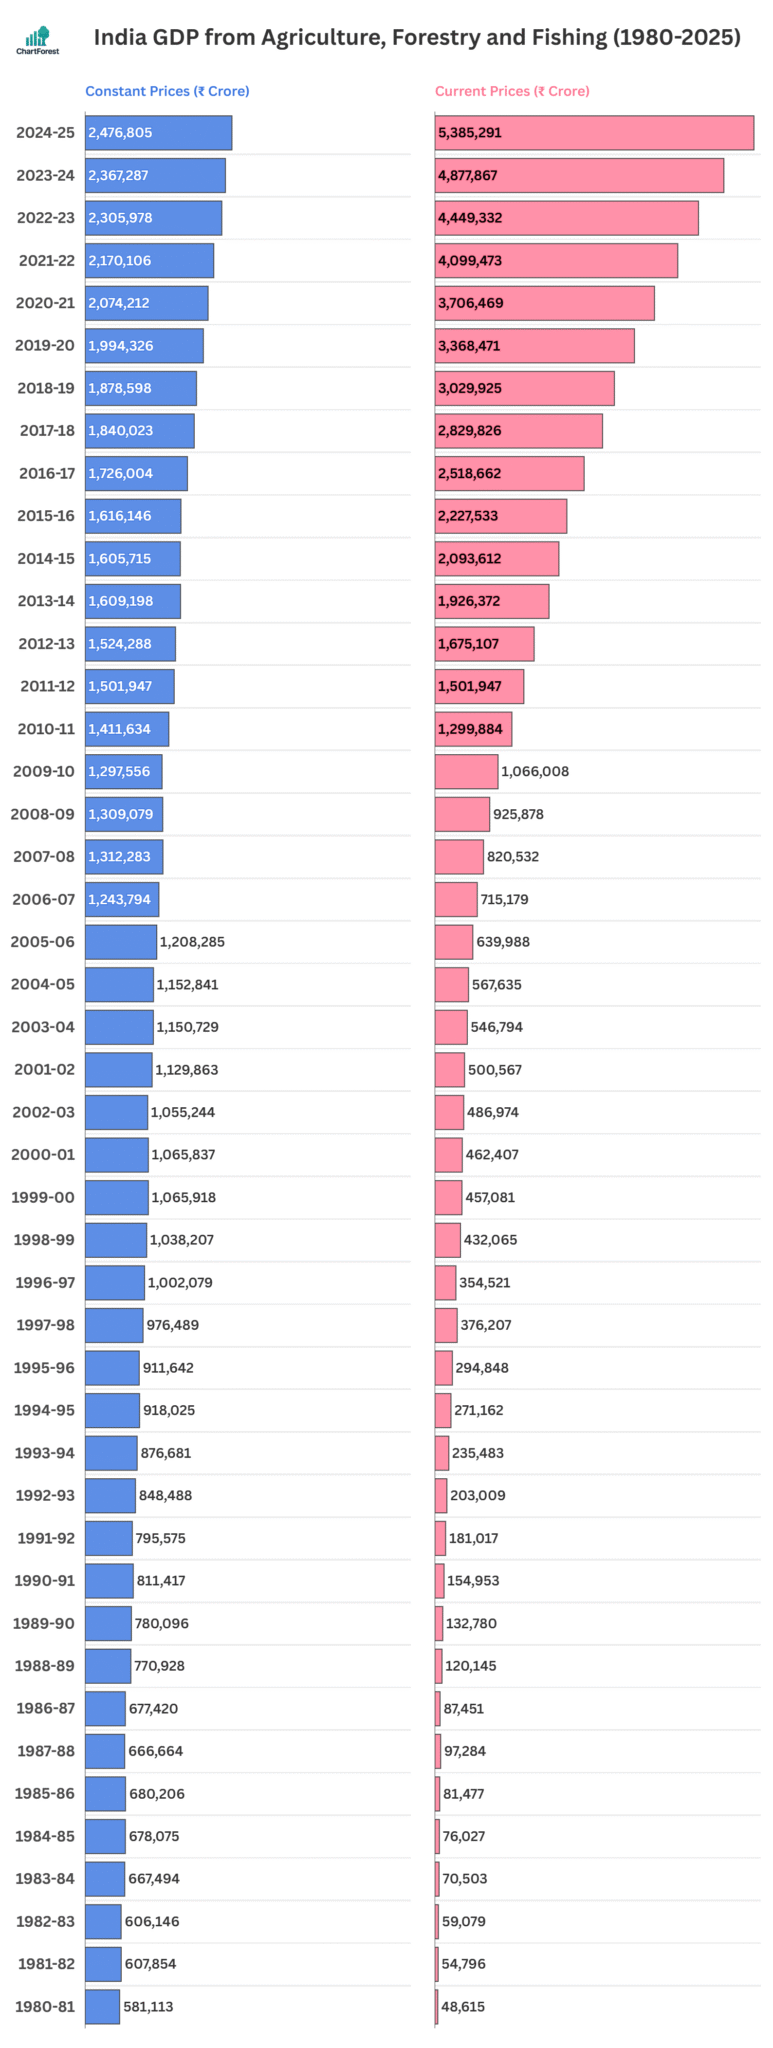
Annual Real Output from Agriculture, Forestry, and Fishing GVA (Constant Base Year: 2011–12)
- 2024–25: ₹24.77 lakh crore (approx. $303 billion)
- 2023–24: ₹23.67 lakh crore (approx. $290 billion)
- Growth rate: 4.6% year-on-year
India’s agriculture, forestry, and fishing output recorded a real GVA of ₹24.77 lakh crore in FY 2024–25, reflecting a steady 4.6% growth. This performance highlights stable output supported by good monsoon coverage and improved cropping intensity.
Annual Nominal Output from Agriculture, Forestry, and Fishing GVA (Current Prices)
- 2024–25: ₹53.85 lakh crore (approx. $659 billion)
- 2023–24: ₹48.78 lakh crore (approx. $597 billion)
- Growth rate: 10.4% year-on-year
At current prices, the nominal GVA from agriculture rose to ₹53.85 lakh crore in FY 2024–25, growing 10.4% over the previous year. This growth captures both higher production and favourable price realisations across food grains, horticulture, and livestock.
Annual Highlights
- Stable real growth of 4.6% supported by favourable monsoon and expanded sown area
- Strong output in food grains, horticulture, and allied activities like livestock and fisheries
- Higher procurement, MSP support, and rural infrastructure investment boosted overall activity
- Improved mechanisation, irrigation coverage, and agri-credit access supported farm productivity
- Contribution to total GVA: approx. 17.6%, reaffirming its central role in India’s economic base
Annual GVA from Agri, Forestry and Fishing Chart
FAQs
It is the value added to the economy by farming, forestry, and fishing activities. This GVA measure shows how much the primary sector contributes to India’s overall economic output.
Agriculture GVA data is published quarterly and annually by the Ministry of Statistics and Programme Implementation (MoSPI) as part of national accounts.
Real GVA is adjusted for inflation and shows true growth over time, while Nominal GVA includes current prices and reflects both growth and price changes.
It reflects the health of India’s rural economy, supports food security, and provides livelihoods to a large portion of the population. It’s crucial for policymaking and tracking agricultural growth.
The data is sourced from official releases by the Ministry of Statistics and Programme Implementation (MoSPI) and is updated quarterly and annually as new figures are published.
Related Indicators
Other Indicators
Monetary Policy & Banking Indicators
Inflation and Price Indicators
Trade & External Sector Indicators
Business & Industrial Indicators
Consumer & Labour Market Indicators
Important
If you notice any discrepancies in the data or find any inaccuracies, please let us know. We will review and correct them as soon as possible.