India GDP/GVA from Mining & Quarrying
India GDP/GVA from Mining & Quarrying: Key Updates
Latest Release
Q2, 2025-26
Constant Prices
₹0.65 lakh crore (–0.04% YoY growth)
Current Prices
₹1.02 lakh crore (–4.3% YoY growth)
Quarterly GVA – Mining & Quarrying Summary (Q2 FY 2025–26)
Real GVA: Mining & Quarrying Output (Constant 2011–12 Prices)
- Q2 2025–26: ₹0.65 lakh crore (₹64,878 crore)
- Q2 2024–25: ₹0.65 lakh crore (₹64,901 crore)
- Growth Rate: –0.04% YoY
Key Takeaway: Mining & Quarrying recorded nearly flat real growth in Q2 FY 2025–26, with output essentially unchanged from last year. The sector continues to show weak momentum, although the contraction seen in previous periods has narrowed substantially.
Nominal GVA: Mining & Quarrying Output (Current Prices)
- Q2 2025–26: ₹1.02 lakh crore (₹1,01,993 crore)
- Q2 2024–25: ₹1.07 lakh crore (₹1,06,597 crore)
- Growth Rate: –4.3% YoY
Key Takeaway: Nominal GVA declined 4.3%, indicating reduced price realisation for minerals such as crude oil, natural gas, and coal, combined with softer commodity market conditions during the quarter.
Real GVA Quarter-wise Trend (YoY Growth)
- Q2 FY 2025–26: –0.04%
- Q2 FY 2024–25: –0.4%
Key Takeaway: Mining & Quarrying has shown two consecutive years of contraction in Q2, though the decline has eased significantly in FY 2025–26. The sector remains subdued compared to other primary and secondary components of GVA.
Key Drivers Behind Performance
- Slow output growth in coal, crude oil, and natural gas
- Weak mining IIP performance (Mining IIP –0.5% YoY)
- Lower commodity prices are affecting the nominal value
- Global market softness and reduced price realisation
- Stable but not strong demand from core industrial sectors
Quarter-wise GVA from Mining & Quarrying: Historical Chart
India's GVA from Mining & Quarrying Chart - Historical & Current Trends
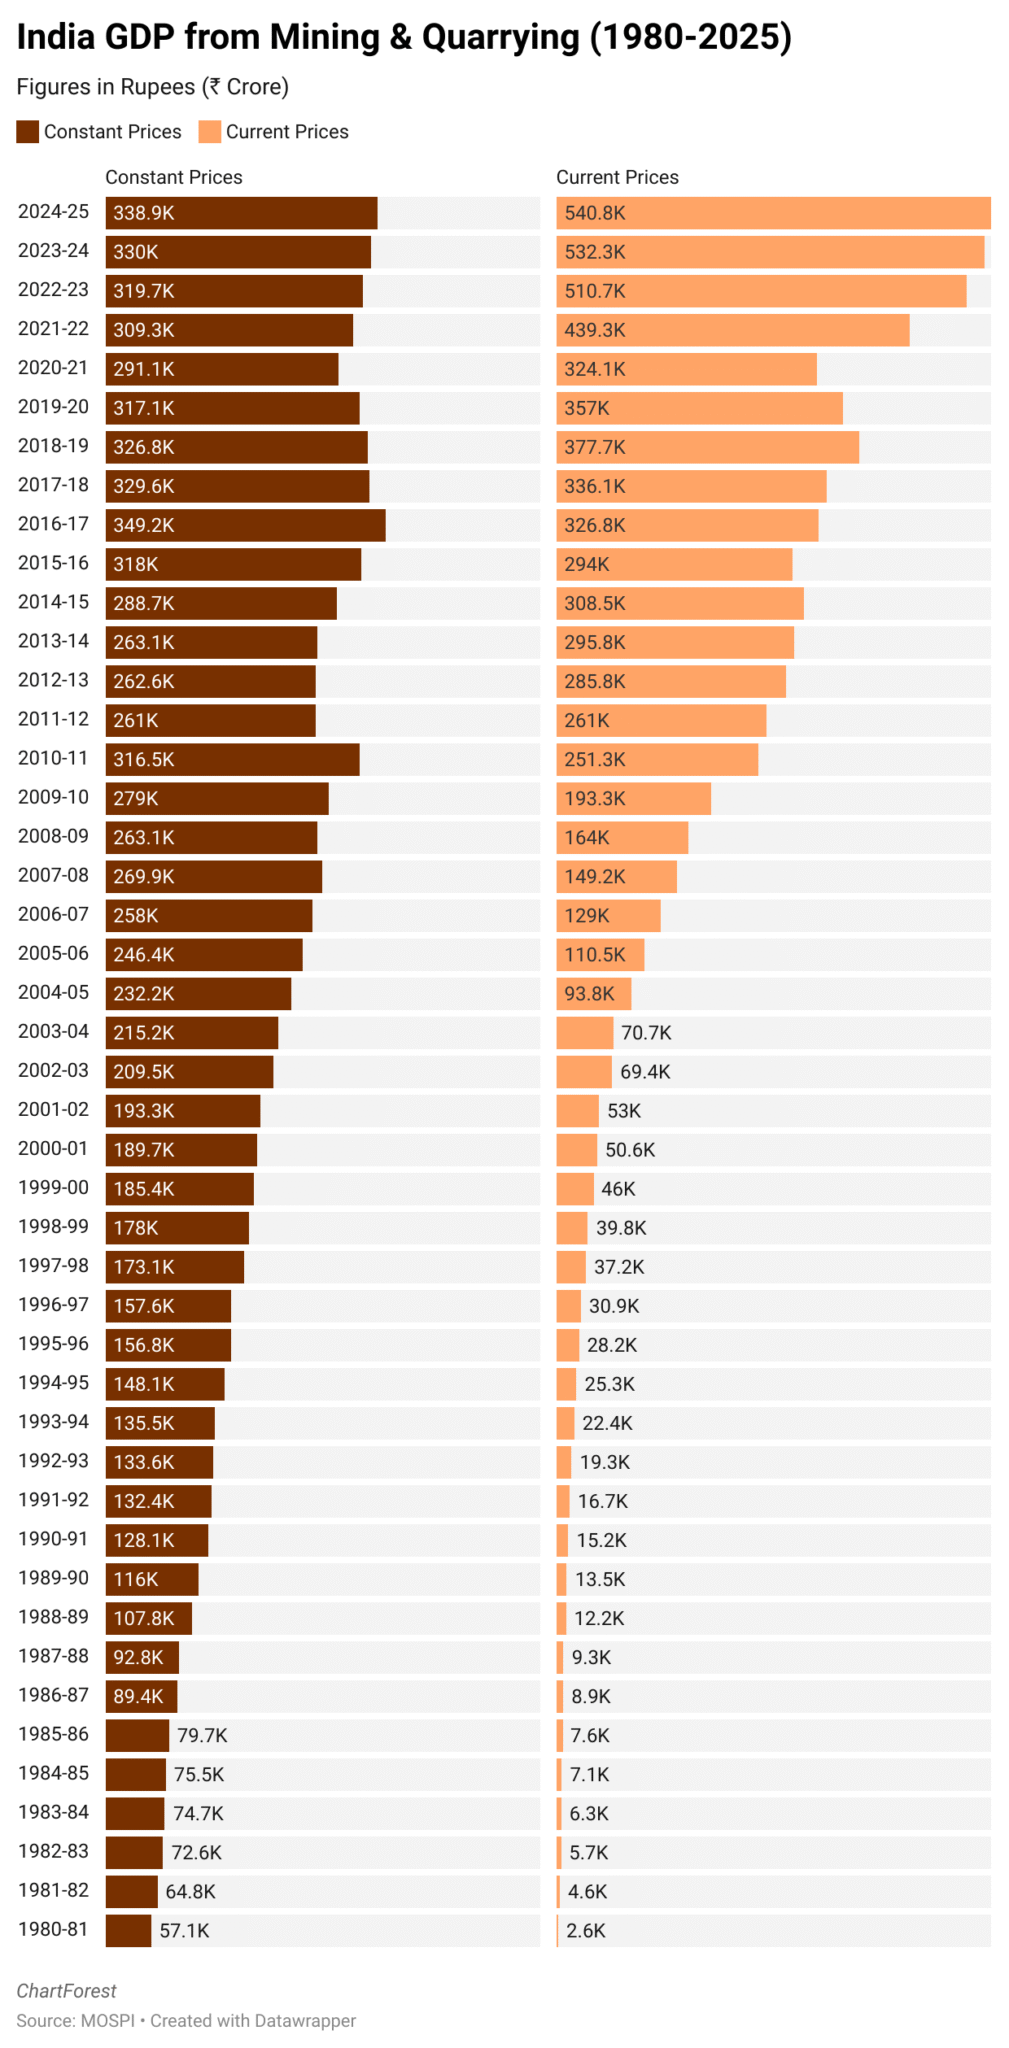
Annual GVA from Mining & Quarrying
Annual GVA Mining & Quarrying Summary (2024–25)
Annual Real Output from Mining & Quarrying GVA (Constant Base Year: 2011–12)
- 2024–25: ₹3.39 lakh crore (approx. $41.4 billion)
- 2023–24: ₹3.30 lakh crore (approx. $40.4 billion)
- Growth rate: 2.7% year-on-year
India’s mining and quarrying sector recorded a real GVA of ₹3.39 lakh crore in FY 2024–25, reflecting a modest 2.7% annual growth. This steady performance was supported by increased output of coal, crude oil, and metal ores, along with sustained industrial demand and regulatory support.
Annual Nominal Output from Mining & Quarrying GVA (Current Prices)
- 2024–25: ₹5.41 lakh crore (approx. $66.1 billion)
- 2023–24: ₹5.32 lakh crore (approx. $65.0 billion)
- Growth rate: 1.6% year-on-year
At current prices, the nominal GVA from mining and quarrying reached ₹5.41 lakh crore in FY 2024–25, rising 1.6% from the previous year. This marginal increase reflects stable commodity prices, muted global demand, and moderate domestic consumption growth in energy and metals.
Annual Highlights
- Modest real GVA growth of 2.7%, driven by higher coal, crude oil, and metallic mineral output
- Recovery in industrial demand supported consistent extraction activity across mineral-rich regions
- Policy focus on mining auctions and production-linked incentives (PLI) improved private sector participation
- Expansion of transport and energy infrastructure supported smoother supply chain operations
- Contribution to total GVA: approx. 2.0%, reflecting mining’s foundational role in India’s industrial ecosystem
Annual GVA from Mining & Quarrying Chart
FAQs
The sector includes extraction of minerals such as coal, lignite, crude petroleum, natural gas, metallic and non-metallic minerals, and quarrying of stone, sand, and other building materials.
The data is released quarterly and annually as part of the National Accounts Statistics by the Ministry of Statistics and Programme Implementation (MoSPI).
Real GVA is adjusted for inflation using constant base-year prices (e.g., 2011–12), while nominal GVA is calculated at current market prices, reflecting actual revenue values.
It supports infrastructure, manufacturing, and energy sectors by providing essential raw materials and fuels, contributing to employment and state revenues.
The data is updated using official estimates published by the Ministry of Statistics and Programme Implementation (MoSPI). It includes quarterly and annual Gross Value Added (GVA) figures at both constant and current prices. The page is refreshed soon after each new release to reflect the latest figures.
Related Indicators
Other Indicators
Monetary Policy & Banking Indicators
Inflation and Price Indicators
Trade & External Sector Indicators
Business & Industrial Indicators
Consumer & Labour Market Indicators
Important
If you notice any discrepancies in the data or find any inaccuracies, please let us know. We will review and correct them as soon as possible.