India GDP/GVA from Public Administration, Defence and Other Services
GDP/GVA from Public Administration, Defence & Other Services: Key Updates
Latest Release
Q2, 2025-26
Constant Prices
₹6.00 lakh crore (9.7% YoY growth)
Current Prices
₹12.35 lakh crore (13.2% YoY growth)
Quarterly GVA – Public Administration Summary (Q2 FY 2025–26)
Real GVA: Public Administration (Constant 2011–12 Prices)
- Q2 2025–26: ₹6.00 lakh crore (₹6,00,343 crore)
- Q2 2024–25: ₹5.47 lakh crore (₹5,47,308 crore)
- Growth Rate: 9.7% YoY
Key Takeaway: Public Administration, Defence & Other Services recorded a strong real growth of 9.7% in Q2 FY 2025–26, maintaining momentum from last year. Increased government spending on administration, defence services, education, healthcare, and other social services contributed to robust expansion.
Nominal GVA: Public Administration (Current Prices)
- Q2 2025–26: ₹12.35 lakh crore (₹12,34,791 crore)
- Q2 2024–25: ₹10.91 lakh crore (₹10,90,638 crore)
- Growth Rate: 13.2% YoY
Key Takeaway: Nominal GVA grew 13.2%, reflecting both strong real activity and moderate price growth in government services, public sector wages, and social sector programs. This segment remains one of the fastest-expanding components of the services sector.
Real GVA Quarter-wise Trend (YoY Growth)
- Q2 FY 2025–26: 9.7%
- Q2 FY 2024–25: 8.9%
Key Takeaway: Growth in Public Administration & Defence has remained consistently high for two consecutive years, driven by sustained policy spending, public service delivery expansion, and increased defence and administrative outlays.
Key Drivers Behind Growth
- Higher expenditure in public administration and governance
- Increased defence-related spending and operational activity
- Expansion in education, health, and social services
- Implementation of central and state welfare programs
- Continued growth in government-supported service delivery infrastructure
Quarter-wise GVA Public Administration: Historical Chart
India's GVA From Public Administration, Defence & Other Services Chart - Historical & Current Trends
Annual GVA From Public Administration
Annual GVA Summary Estimates (2024–25)
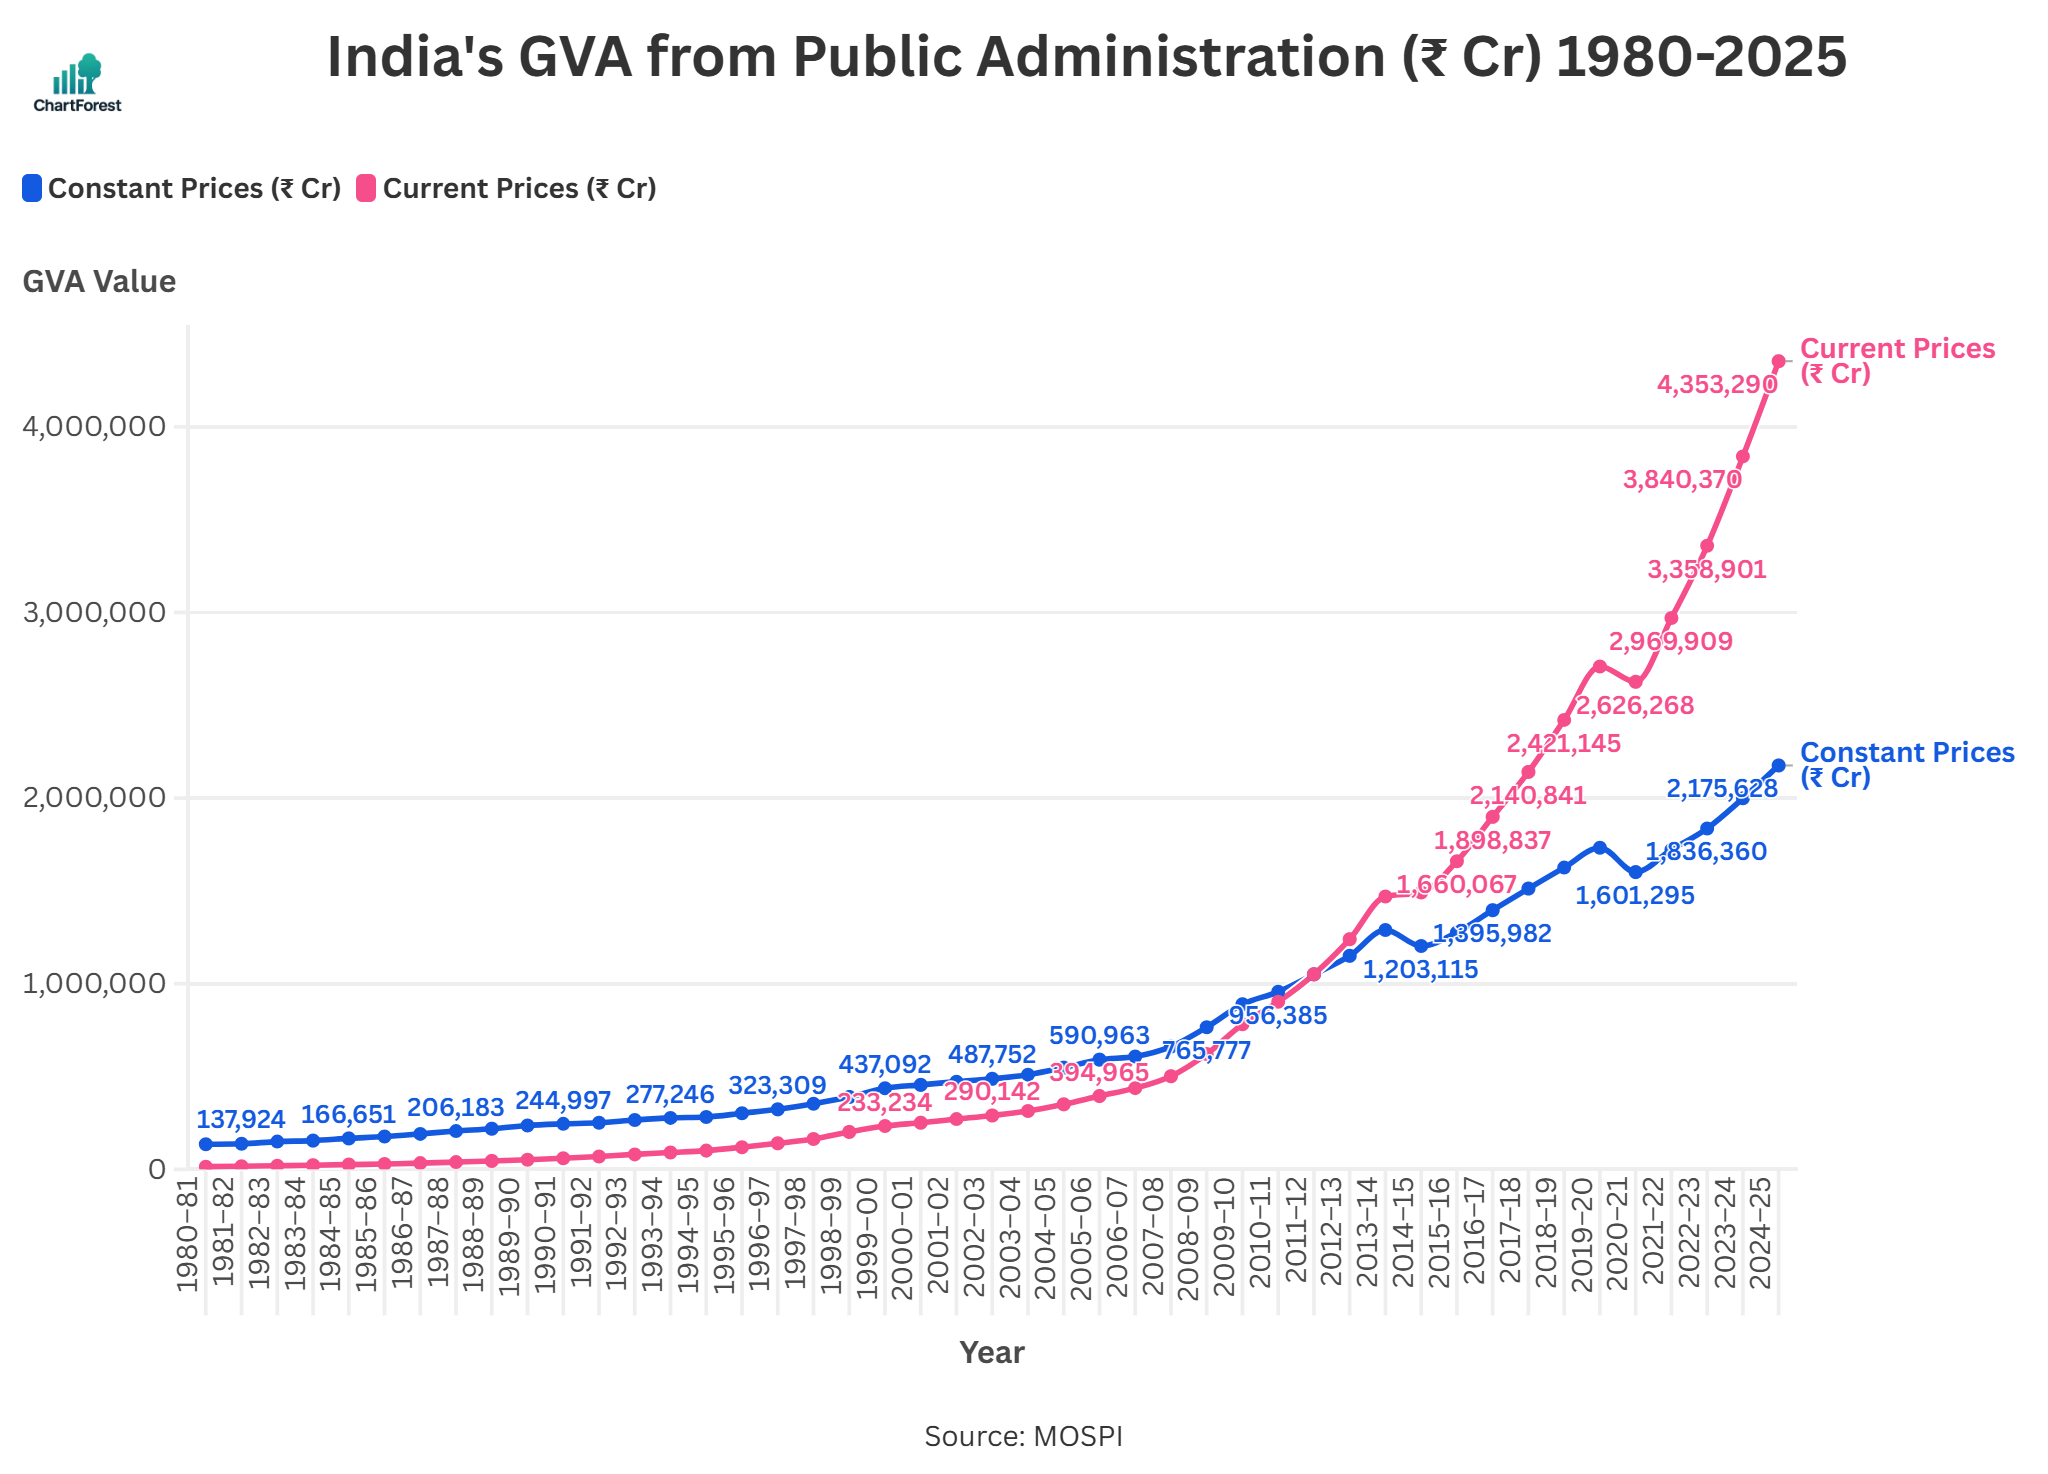
Annual Real Output from Public Administration GVA (Constant Base Year: 2011–12)
- 2024–25: ₹21.76 lakh crore (₹21,75,628 crore) (approx. $261.8 billion)
- 2023–24: ₹19.99 lakh crore (₹19,98,561 crore) (approx. $240.9 billion)
- Growth rate: 8.9% year-on-year
India’s public Administration sector posted a real GVA of ₹21.76 lakh crore in FY 2024–25, reflecting a solid 8.9% inflation-adjusted growth over the previous year. The expansion was driven by higher budget allocations across governance, social services, defence, and administrative infrastructure.
Annual Nominal Output from Public Administration GVA (Current Prices)
- 2024–25: ₹43.53 lakh crore (₹43,53,290 crore) (approx. $523.9 billion)
- 2023–24: ₹38.40 lakh crore (₹38,40,370 crore) (approx. $462.7 billion)
- Growth rate: 13.4% year-on-year
At current prices, nominal GVA from public Administration rose to ₹43.53 lakh crore, a 13.4% increase year-on-year. This sharp growth reflects higher wage payouts, increased defence and welfare spending, and continued expansion of health, education, and administrative services.
Annual GVA From Public Administration Chart
FAQs
In GDP and national accounts, Public Services refers to Public Administration, Defence, and Other Services such as education, health, social work, and community services. It captures government operations, public institutions, and essential services provided to the population.
GVA from Public Services is estimated using data on: Government expenditure at central, state, and local levels, Compensation of employees (salaries, pensions), and Output from education, health, defence, and community services.
It reflects the scale and impact of government operations and social development initiatives. Growth in this sector indicates: Expanded public service delivery, Rising public employment, and Increased welfare spending and governance activity.
The data is compiled and released by India’s Ministry of Statistics and Programme Implementation (MoSPI). It’s published in: Quarterly GDP reports, and Annual National Accounts Statistics (NAS)
Public Administration GVA is updated:: Quarterly, along with GDP data, and Annually, as part of the Provisional Estimates (May) and Revised Estimates (January and February of subsequent years)
Related Indicators
Other Indicators
Monetary Policy & Banking Indicators
Inflation and Price Indicators
Trade & External Sector Indicators
Business & Industrial Indicators
Consumer & Labour Market Indicators
Important
If you notice any discrepancies in the data or find any inaccuracies, please let us know. We will review and correct them as soon as possible.