India GDP/GVA From Construction
India GDP/GVA From Construction: Key Updates
Latest Release
Q2, 2025-26
Constant Prices
₹3.74 lakh crore (7.2% YoY growth)
Current Prices
₹6.19 lakh crore (6.9% YoY growth)
Quarterly GVA – Construction Summary (Q2 FY 2025–26)
Real GVA: Construction Output (Constant 2011–12 Prices)
- Q2 2025–26: ₹3.74 lakh crore (₹3,73,634 crore)
- Q2 2024–25: ₹3.49 lakh crore (₹3,48,601 crore)
- Growth Rate: 7.2% YoY
Key Takeaway: Construction grew 7.2% in real terms during Q2 FY 2025–26, slightly moderating from last year’s 8.4%. Growth remains strong, supported by continuous public infrastructure spending, private real estate activity, and rising demand for cement and steel.
Nominal GVA: Construction Output (Current Prices)
- Q2 2025–26: ₹6.19 lakh crore (₹6,19,385 crore)
- Q2 2024–25: ₹5.79 lakh crore (₹5,79,349 crore)
- Growth Rate: 6.9% YoY
Key Takeaway: Nominal GVA increased 6.9%, reflecting moderate price pressures in construction materials and continued expansion in both public and private sector projects. Price-driven contribution was lower than volume-driven growth, signalling strong real activity.
Real GVA Quarter-wise Trend (YoY Growth)
- Q2 FY 2025–26: 7.2%
- Q2 FY 2024–25: 8.4%
Key Takeaway: Construction remains one of the most resilient and high-growth segments of the economy. While growth has eased marginally due to a high base, underlying activity remains robust across infrastructure, housing, and commercial real estate.
Key Drivers Behind Growth
- Strong ongoing public infrastructure investment (roads, metro, rail, logistics)
- Steady rise in private real estate activity, especially urban housing
- Higher consumption of cement (+7.3%) and steel (+8.8%)
- Improved project execution due to better weather and labour availability
- Support from government capital expenditure and state-level infrastructure programs
Quarter-wise GVA From Construction: Historical Chart
India's GVA From Construction Chart - Historical & Current Trends
Annual GVA From Construction
Annual GVA from Construction Summary Estimates (2024–25)
Annual Real Output from Construction GVA (Constant Base Year: 2011–12)
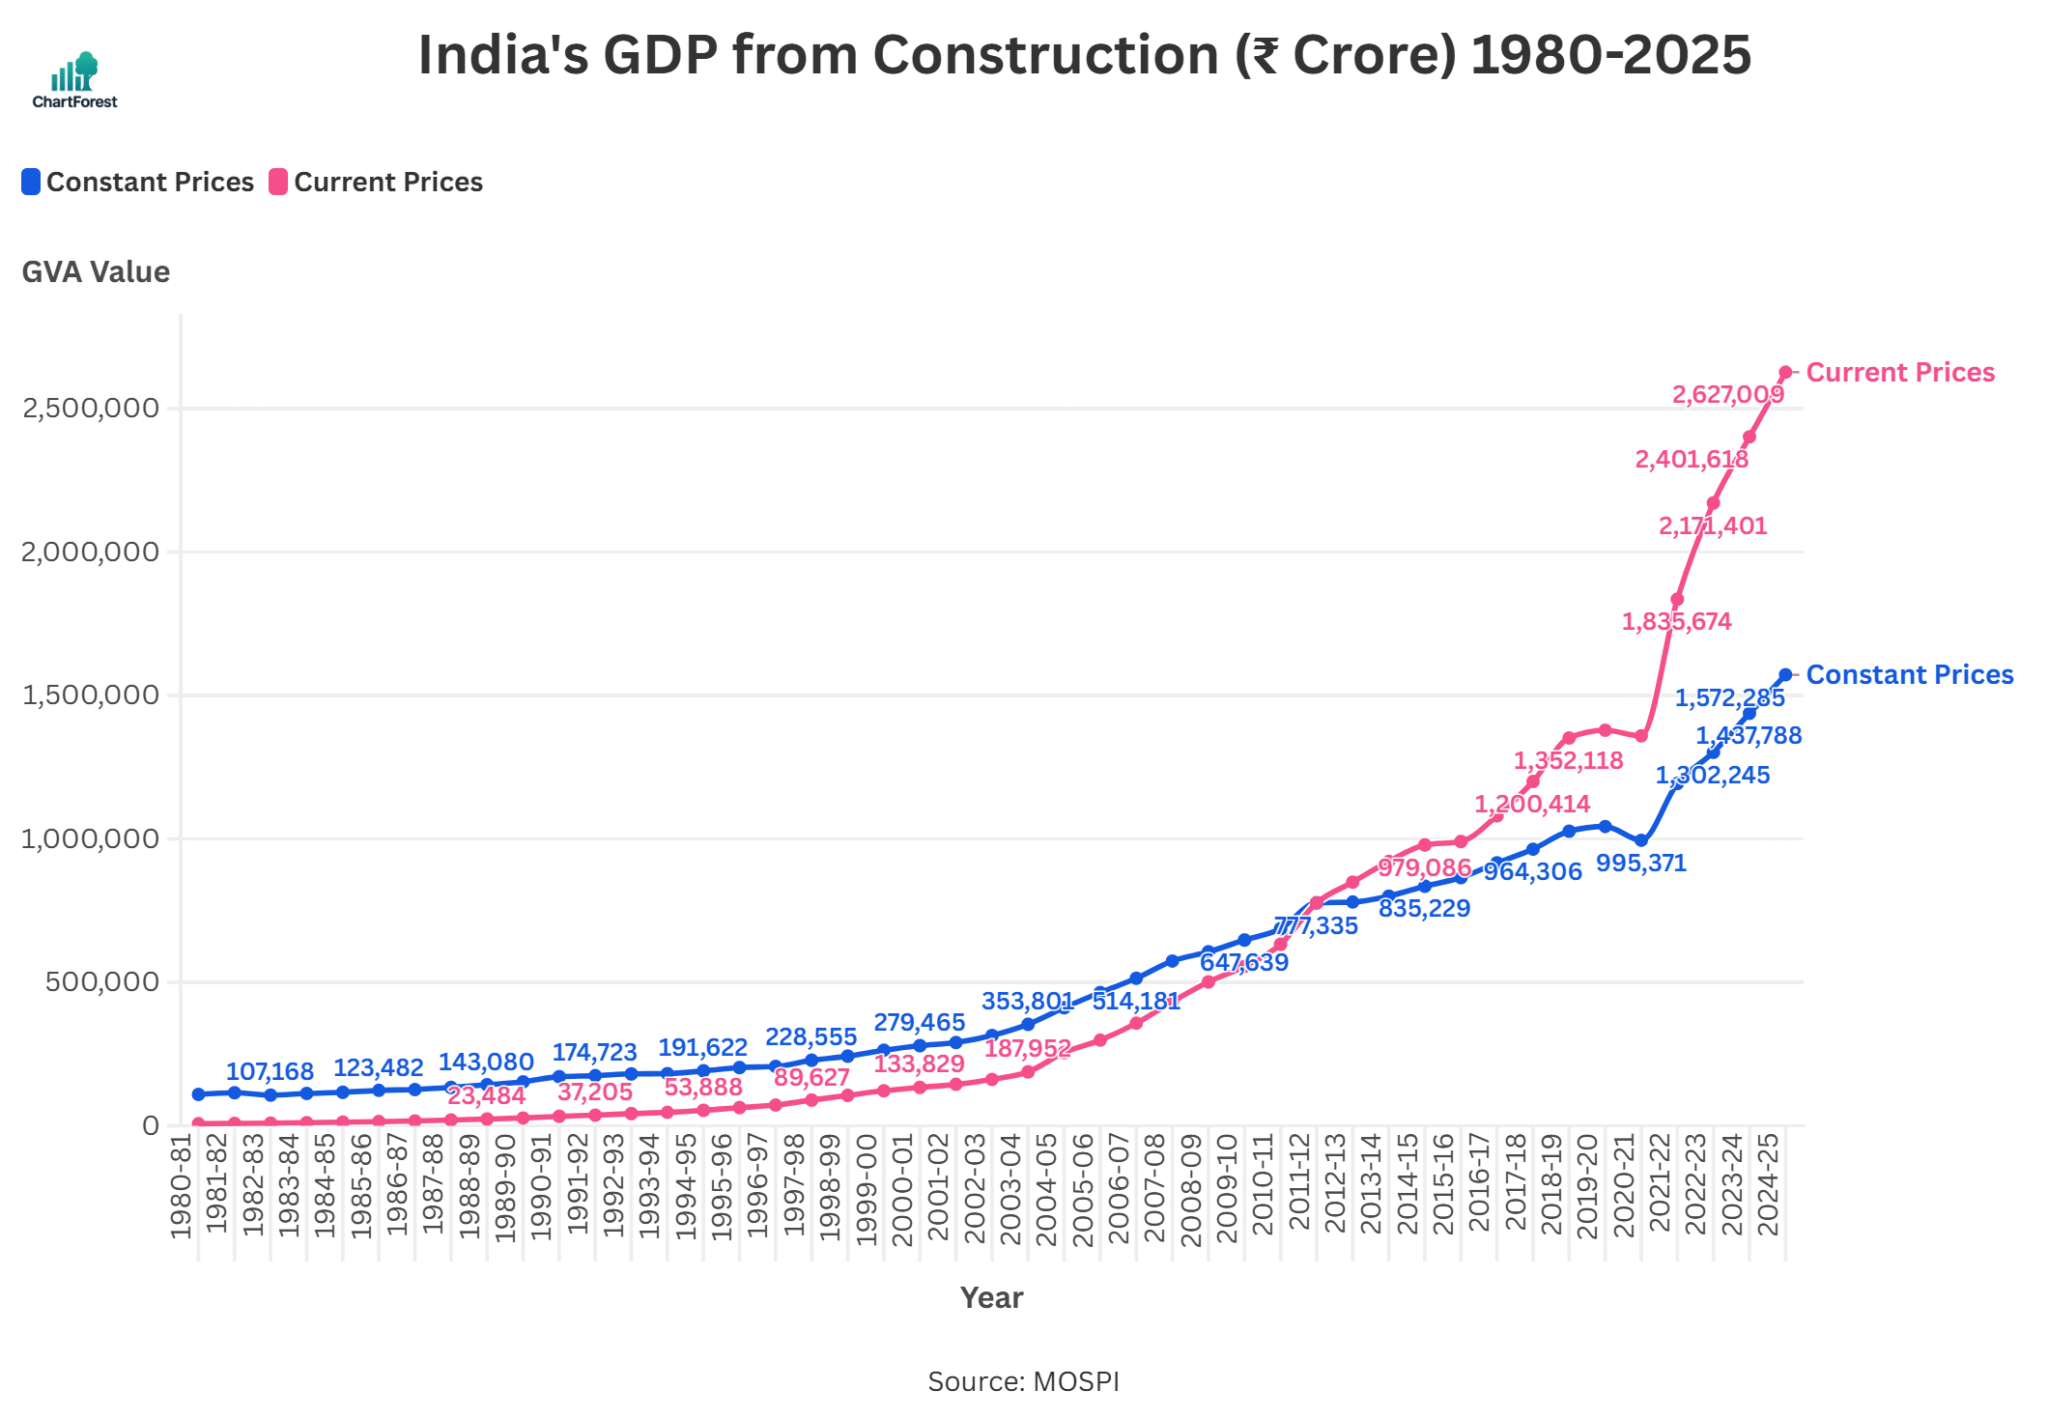
- 2024–25: ₹15.72 lakh crore (₹15,72,285 crore) (approx. $189.4 billion)
- 2023–24: ₹14.38 lakh crore (₹14,37,788 crore) (approx. $173.1 billion)
- Growth rate: 9.4% year-on-year
India’s construction sector posted a real GVA of ₹15.72 lakh crore in FY 2024–25, showing a robust 9.4% growth over the previous year. The growth was driven by higher government capital spending, real estate revival, and strong infrastructure demand across transport and housing.
Annual Nominal Output from Construction GVA (Current Prices)
- 2024–25: ₹26.27 lakh crore (₹26,27,009 crore) (approx. $316.5 billion)
- 2023–24: ₹24.01 lakh crore (₹24,01,618 crore) (approx. $289.3 billion)
- Growth rate: 9.4% year-on-year
At current prices, nominal GVA from construction rose to ₹26.27 lakh crore, marking a 9.4% increase from FY 2023–24. This reflects both strong physical expansion and higher input costs, particularly in cement, steel, and skilled labor.
Annual GVA From Construction Chart
FAQs
In GDP and national accounts, Construction refers to economic activities related to building infrastructure. This includes residential and commercial buildings, roads, bridges, dams, metro projects, ports, and public infrastructure development.
It is estimated using: Government capital expenditure, Financial data from construction firms, Input cost surveys, and Labour and wage statistics. MoSPI uses these indicators to estimate both real (inflation-adjusted) and nominal (current price) values.
Construction is a high-employment, high-investment sector. GVA from Construction reflects the health of: Public infrastructure spending, Real estate cycles, and Urban development.
The data is compiled and released by India’s Ministry of Statistics and Programme Implementation (MoSPI). It’s published in: Quarterly GDP reports, and Annual National Accounts Statistics (NAS)
GVA from Construction is published: Quarterly, along with GDP data, and Annually, as part of the Provisional Estimates (May) and Revised Estimates (January and February of subsequent years)
Related Indicators
Other Indicators
Monetary Policy & Banking Indicators
Inflation and Price Indicators
Trade & External Sector Indicators
Business & Industrial Indicators
Consumer & Labour Market Indicators
Important
If you notice any discrepancies in the data or find any inaccuracies, please let us know. We will review and correct them as soon as possible.