India GDP/GVA From Manufacturing Sector
GDP/GVA from Manufacturing: Key Updates
Latest Release
Q2, 2025-26
Constant Prices
₹7.87 lakh crore (9.1% YoY growth)
Current Prices
₹11.29 lakh crore (11.7% YoY growth)
Quarterly GVA – Manufacturing Summary (Q2 FY 2025–26)
Real GVA: Manufacturing Sector Output (Constant 2011–12 Prices)
- Q2 2025–26: ₹7.87 lakh crore (₹7,86,670 crore)
- Q2 2024–25: ₹7.21 lakh crore (₹7,20,846 crore)
- Growth Rate: 9.1% YoY
Key Takeaway: Manufacturing GVA at constant prices grew a strong 9.1%, a sharp acceleration compared to 2.2% growth in the same quarter last year. This reflects a solid rebound in industrial production and improved corporate sector performance.
Nominal GVA: Manufacturing Sector Output (Current Prices)
- Q2 2025–26: ₹11.29 lakh crore (₹11,28,529 crore)
- Q2 2024–25: ₹10.10 lakh crore (₹10,10,480 crore)
- Growth Rate: 11.7% YoY
Key Takeaway: Nominal GVA growth of 11.7% indicates improved pricing power, stronger revenues, and better profitability in the manufacturing sector.
Real GVA Quarter-wise Trend (YoY Growth)
- Q2 FY 2025–26: 9.1%
- Q2 FY 2024–25: 2.2%
Key Takeaway: Manufacturing has sustained high growth for two consecutive years, highlighting continued strength in industrial activity.
Drivers Behind Manufacturing Growth
- Higher output of steel, cement, and capital goods
- Improved performance of listed manufacturing companies
- Strong credit growth in the industry
- Stable inflation supporting cost structures
- Healthy demand from construction, infrastructure, and exports
Quarter-wise Manufacturing GVA: Historical Chart
India's GVA Manufacturing Chart - Historical & Current Trends
Annual GVA from manufacturing
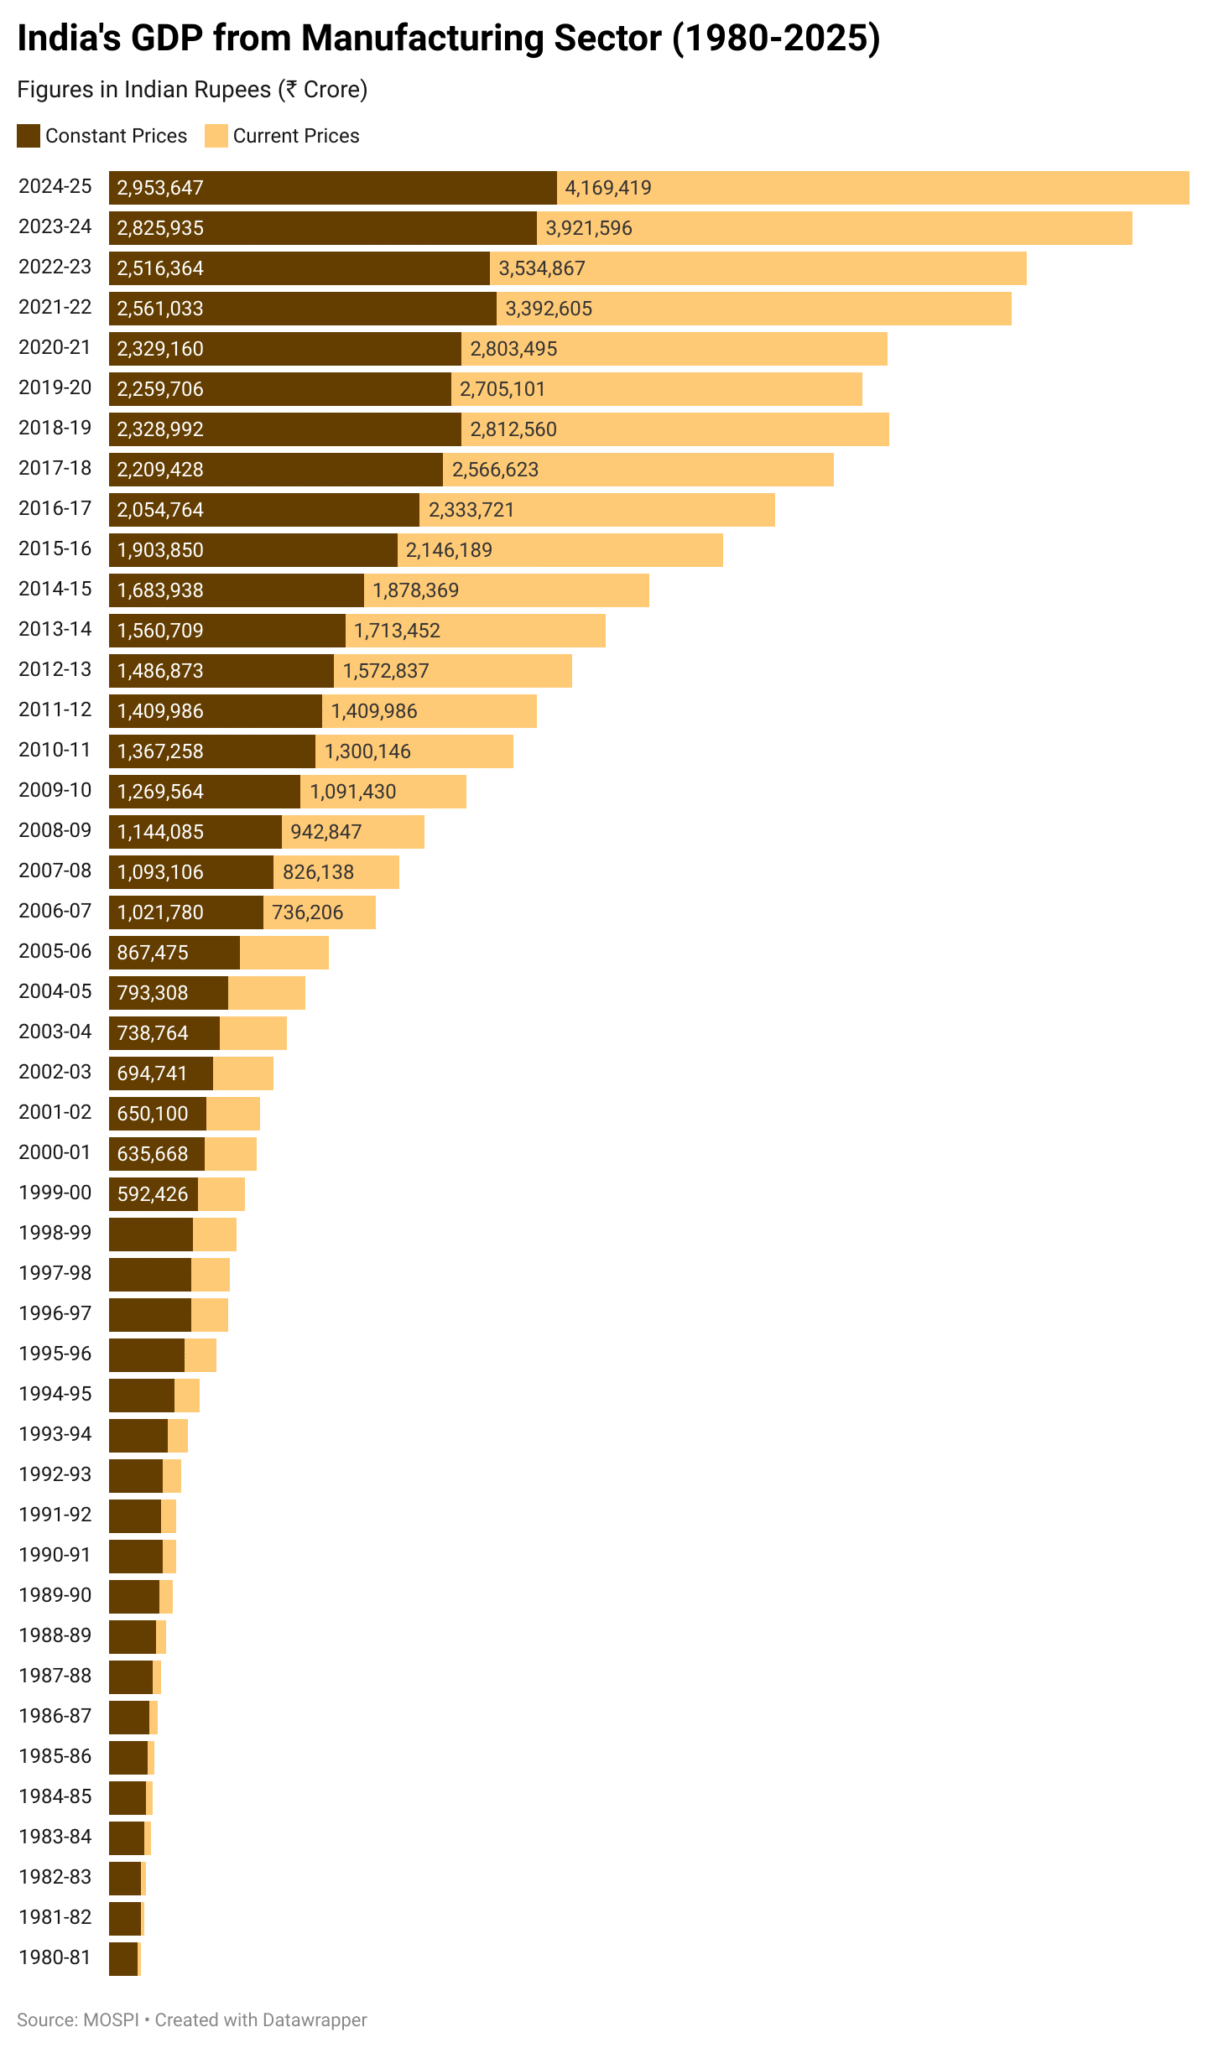
Annual GVA Manufacturing Summary Estimates (2024–25)
Annual Real Output from Manufacturing GVA (Constant Base Year: 2011–12)
- 2024–25: ₹29.54 lakh crore (approx. $356 billion)
- 2023–24: ₹28.26 lakh crore (approx. $340 billion)
- Growth rate: 4.5% year-on-year
India’s manufacturing sector generated a real GVA of ₹29.54 lakh crore (approx. $356 billion) in FY 2024–25, reflecting a 4.5% inflation-adjusted growth. The sector showed a moderate but steady recovery after strong gains in previous years.
Annual Nominal Output from Manufacturing GVA (Current Prices)
- 2024–25: ₹41.69 lakh crore (approx. $502 billion)
- 2023–24: ₹39.20 lakh crore (approx. $472 billion)
- Growth rate: 6.3% year-on-year
At current prices, the manufacturing sector’s nominal GVA rose to ₹41.69 lakh crore (approx. $502 billion), growing 6.3% over FY 2023–24. This includes real output gains and price variations across manufacturing sub-sectors.
Annual Highlights
- Moderate real growth following two consecutive years of double-digit expansion
- Output is driven by sectors like automobiles, electronics, and pharmaceuticals
- Improvement in input cost stability and production efficiency
- Momentum supported by Make in India, PLI schemes, and global supply chain diversification
- Contribution to total GVA: approx. 17.2%, maintaining its role as a key industrial pillar
Annual GVA from manufacturing Chart
FAQs
GDP from Manufacturing refers to the total value of goods produced by the manufacturing sector within India during a specific time period. It’s part of the Gross Value Added (GVA) and contributes to the overall GDP.
It is calculated using the Gross Value Added (GVA) method, which measures the value of output produced minus the value of intermediate inputs. The data comes from: Index of Industrial Production (IIP), Company financials, Sectoral surveys (e.g., cement, steel, automobiles), Government and private sector data.
Real GVA: Adjusted for inflation; shows true production volume at 2011–12 prices. Nominal GVA: Includes inflation; reflects current market value in today’s prices.
The manufacturing sector contributes around 17–18% of India’s GVA, supports large-scale employment, especially in MSMEs, and is a key driver for exports, investment, and infrastructure.
GVA from manufacturing is released: Quarterly as part of India’s GDP estimates and annually in detail through MoSPI’s GDP and GVA reports.
We update the manufacturing GVA figures using the official data released by the Government of India, primarily sourced from the National Statistics Office (NSO) and, the Ministry of Statistics and Programme Implementation (MoSPI). Data is updated immediately after official press releases.
Related Indicators
Other Indicators
Monetary Policy & Banking Indicators
Inflation and Price Indicators
Trade & External Sector Indicators
Business & Industrial Indicators
Consumer & Labour Market Indicators
Important
If you notice any discrepancies in the data or find any inaccuracies, please let us know. We will review and correct them as soon as possible.