India GDP/GVA From Utility Services (electricity, gas, water etc.)
India GDP/GVA from Utility Services: Key Updates
Latest Release
Q2, 2025-26
Constant Prices
₹1.08 lakh crore (4.4% YoY growth)
Current Prices
₹1.99 lakh crore (3.7% YoY growth)
Quarterly GVA – Utility Services Summary (Q2 FY 2025–26)
Real GVA: Utility Services Output (Constant 2011–12 Prices)
- Q2 2025–26: ₹1.08 lakh crore (₹1,07,519 crore)
- Q2 2024–25: ₹1.03 lakh crore (₹1,02,970 crore)
- Growth Rate: 4.4% YoY
Key Takeaway: Utility Services grew 4.4% in real terms in Q2 FY 2025–26, improving from the 3.0% growth recorded last year. The rise was supported by higher electricity generation, increased grid demand, and steady industrial power consumption.
Nominal GVA: Utility Services Output (Current Prices)
- Q2 2025–26: ₹1.99 lakh crore (₹1,99,237 crore)
- Q2 2024–25: ₹1.92 lakh crore (₹1,92,042 crore)
- Growth Rate: 3.7% YoY
Key Takeaway: Nominal GVA rose 3.7%, indicating stable price conditions in the electricity and utilities sector. Despite moderate tariff adjustments, price-driven growth remained modest, with most gains coming from increased demand.
Real GVA Quarter-wise Trend (YoY Growth)
- Q2 FY 2025–26: 4.4%
- Q2 FY 2024–25: 3.0%
Key Takeaway: Utility Services show a consistent upward trend, with growth strengthening in FY 2025–26 due to higher power usage across industrial, commercial, and residential segments.
Key Drivers Behind Growth
- Higher electricity generation and improved supply reliability
- Increased industrial and commercial power demand
- Growth in renewable energy output feeding into grids
- Steady expansion of transmission and distribution infrastructure
- Rising consumption from digital services, manufacturing, and households
Quarter-wise GVA from Utility Services: Historical Chart
India's GVA From Utility Services Chart - Historical & Current Trends
Annual GVA from Utility Services
Annual GVA Utility Services Summary Estimates (2024–25)
Annual Real Output from Utility Services GVA (Constant Base Year: 2011–12)
- 2024–25: ₹15.72 lakh crore (₹15,72,285 crore) (approx. $189.4 billion)
- 2023–24: ₹14.38 lakh crore (₹14,37,788 crore) (approx. $173.1 billion)
- Growth rate: 9.4% year-on-year
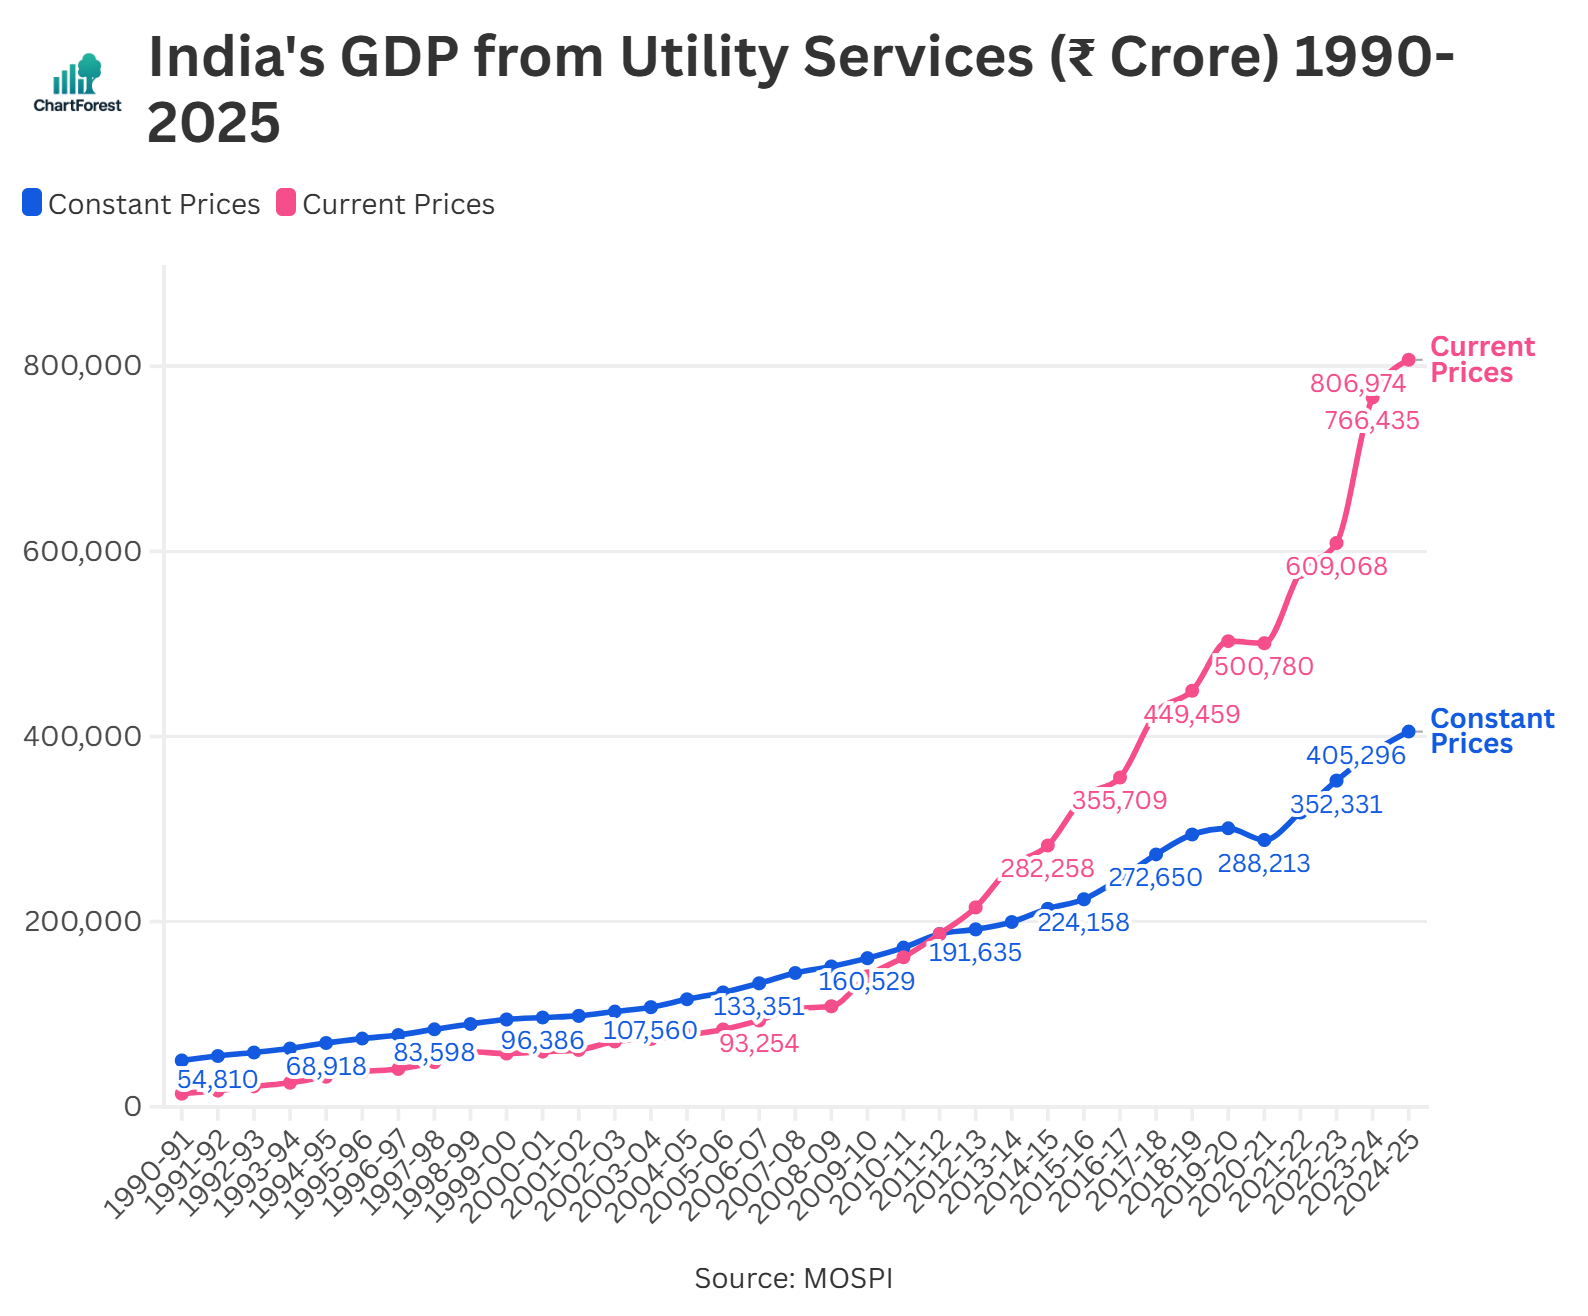
India’s utility services sector (electricity, gas, water supply & other utilities) generated a real GVA of ₹4.05 lakh crore (approx. $48.8 billion) in FY 2024–25, reflecting a 5.9% inflation-adjusted growth. The sector maintained solid momentum amid rising urban demand, industrial expansion, and infrastructure modernisation.
Annual Nominal Output from Utility Services GVA (Current Prices)
- 2024–25: ₹8.07 lakh crore (₹8,06,974 cr) (approx. $97.2 billion)
- 2023–24: ₹7.66 lakh crore (₹7,66,435 cr) (approx. $92.3 billion)
- Growth rate: 5.3% year-on-year
At current prices, the nominal GVA from utility services rose to ₹8.07 lakh crore, up 5.3% year-on-year. The increase reflects a combination of real output growth and modest price adjustments in the energy and water sectors.
Annual GVA from Utility Services Chart
FAQs
“Utility Services” refers to the Electricity, Gas, Water Supply, and Other Utility Services sector as classified by India’s national accounts. It includes the generation and distribution of electricity, gas pipelines, water supply, and similar public utility infrastructure.
The GDP (or GVA) from Utility Services is estimated using index-based methods, primarily the Index of Industrial Production (IIP) for electricity, production/consumption data for gas and water supply, and financial performance indicators from public and private utilities.
Yes. India’s GDP data is reported both in:
- Constant prices (Real GVA): Adjusted for inflation using base year prices (currently 2011–12)
- Current prices (Nominal GVA): Reflects the actual market value without inflation adjustment
This sector is crucial for measuring infrastructure readiness, industrial power usage, and the urban-rural service gap. It also reflects policy impact from energy reforms, electrification drives, and water infrastructure projects.
The data is published by the National Statistical Office (NSO), Ministry of Statistics and Programme Implementation (MoSPI), Government of India. It is part of the quarterly and annual GDP releases.
GDP from Utility Services is updated quarterly, with final annual figures released as part of the Provisional Estimates (May) and Revised Estimates in subsequent years.
We update the GDP Utility Services figures using the official data released by the Government of India, primarily sourced from the National Statistics Office (NSO) and the Ministry of Statistics and Programme Implementation (MoSPI). Data is updated immediately after official press releases.
Related Indicators
Other Indicators
Monetary Policy & Banking Indicators
Inflation and Price Indicators
Trade & External Sector Indicators
Business & Industrial Indicators
Consumer & Labour Market Indicators
Important
If you notice any discrepancies in the data or find any inaccuracies, please let us know. We will review and correct them as soon as possible.