
Goods and Services Tax (GST)
GST in India: Key Updates
Latest Release
June, 2025
June 2025
₹1,84,597 crore (Gross)
June 2024
₹1,73,813 crore (Gross)
Growth %
▲6.2% (YoY)
GST Collection Summary for June 2025
Overall GST Revenue Growth (June 2025)
Gross GST Revenue: ₹1,84,597 crore (Growth: 6.2% year-on-year)
Net GST Revenue (after refunds): ₹1,59,106 crore (Growth: 3.3% year-on-year)
Breakdown by Tax Components (June 2025)
- CGST: ₹34,558 crore (up from ₹32,627 crore; 5.9% growth)
- SGST: ₹43,268 crore (up from ₹40,715 crore; 6.3% growth)
- IGST: ₹93,280 crore (up from ₹87,310 crore; 6.8% growth)
- Cess: ₹13,491 crore (up from ₹13,160 crore; 2.5% growth)
Domestic vs Import Revenue
- Gross Domestic Revenue: ₹1,38,906 crore (4.6% growth)
- Gross Import Revenue: ₹45,690 crore (11.4% growth)
Refunds
- Total Refunds (June 2025): ₹25,491 crore (up from ₹19,853 crore)
- Growth: +28.4% in total refunds
- Domestic Refunds: ₹12,643 crore (+14.1% growth)
- Export GST Refunds: ₹12,848 crore (+46.4% growth)
SGST & IGST Settlement to States/UTs
- SGST Pre-Settlement Growth: 9%
- SGST Post-Settlement Growth: 2%
- Note: Post-settlement growth remains modest due to IGST settlement adjustments.
Other Notable Points
- Nagaland saw the highest GST revenue growth at +71%, followed by Tripura (+18%) and Sikkim (+15%).
- States with negative growth: Manipur (-36%), Mizoram (-29%), Uttar Pradesh (-4%).
- Net Customs Revenue (June 2025): ₹32,843 crore (up 1.9%)
- Cumulative Gross GST Revenue (Apr-Jun 2025): ₹6,22,363 crore (+11.8% YoY)
- Cumulative Net GST Revenue (Apr-Jun 2025): ₹5,42,533 crore (+10.7% YoY)
India GST Performance Dashboard
| Category | June 2025 (₹ Cr) | June 2024 (₹ Cr) | YoY Change (%) | Quick Insight |
|---|---|---|---|---|
| Domestic GST | 1,38,906 | 1,32,800 | 4.6% | Moderate growth in domestic consumption |
| Import GST | 45,690 | 41,012 | 11.4% | Good rise in imports and trade activity |
| Gross GST Collection | 1,84,597 | 1,73,813 | 6.2% | Stable overall GST revenue growth |
| Export Refunds | 12,848 | 8,773 | 46.4% | Strong surge in export-related refunds |
| Domestic Refunds | 12,643 | 11,080 | 14.1% | Rise in domestic claim settlements |
| Total Refunds | 25,491 | 19,853 | 28.4% | Higher refunds pushed by export and domestic claims |
| Net Domestic Revenue | 1,26,263 | 1,21,720 | 3.7% | Slow but positive internal tax base growth |
| Net Customs Revenue | 32,843 | 32,239 | 1.9% | Slight growth from import-based collections |
| Net GST Revenue | 1,59,106 | 1,53,959 | 3.3% | Modest net gain, offset by rising refunds |
About GST
GST is an all-encompassing tax that India introduced on July 1st, 2017, as a fresh start from all those older indirect taxes like excise duty, VAT, and service tax. It’s all about creating a unified ‘One Nation, One Tax’ system to streamline things and get rid of tax-on-tax troubles. Plus, it helps stop people from dodging taxes, broadens the base of taxpayers, and introduces user-friendly online systems that make business operations smoother.
GST has these three parts: the Central GST (CGST), State/Union Territory GST (SGST/UTGST), and Integrated GST (IGST), which work together to keep things orderly. There’s also a heads-up on new compliance measures like e-Way Bills and e-invoicing to make it even more efficient.
The Goods and Services Tax (GST) structure comprises five primary rate categories: 0%, 5%, 12%, 18%, and 28%. These rates are assigned based on the classification of goods and services, with essential items generally exempt from taxation or subject to lower rates. In contrast, luxury items and goods deemed non-essential or harmful are subject to higher tax rates, including additional cess.
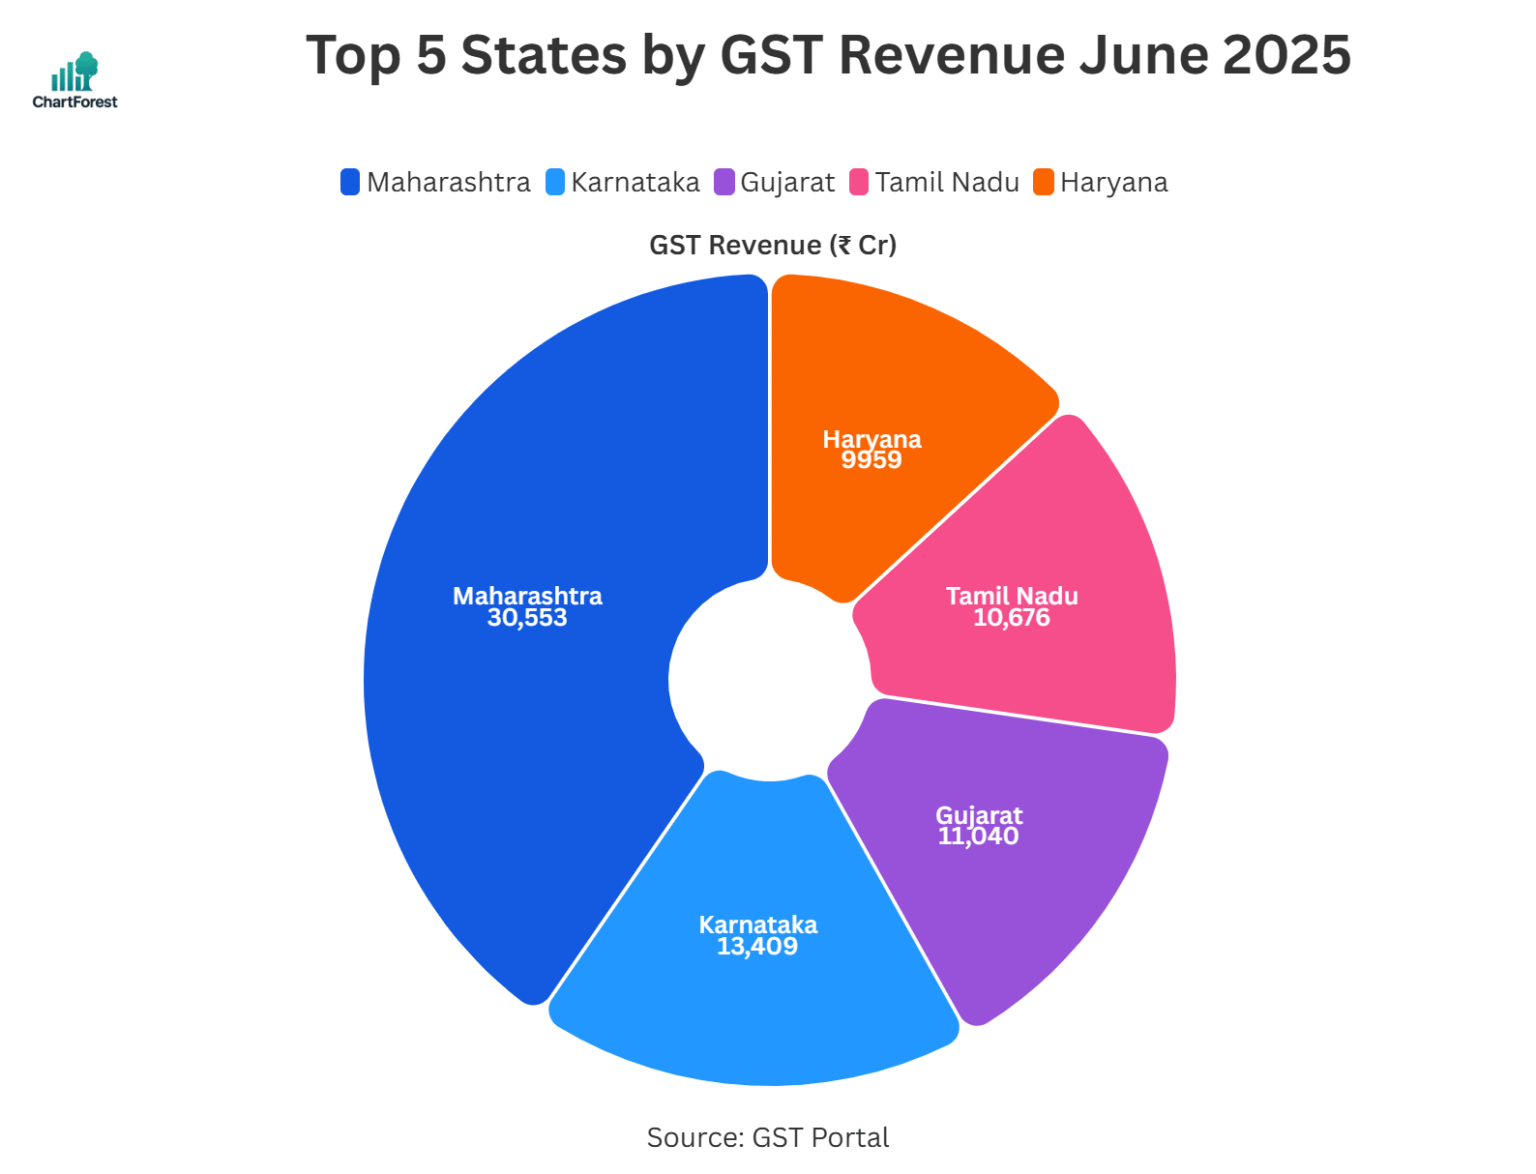
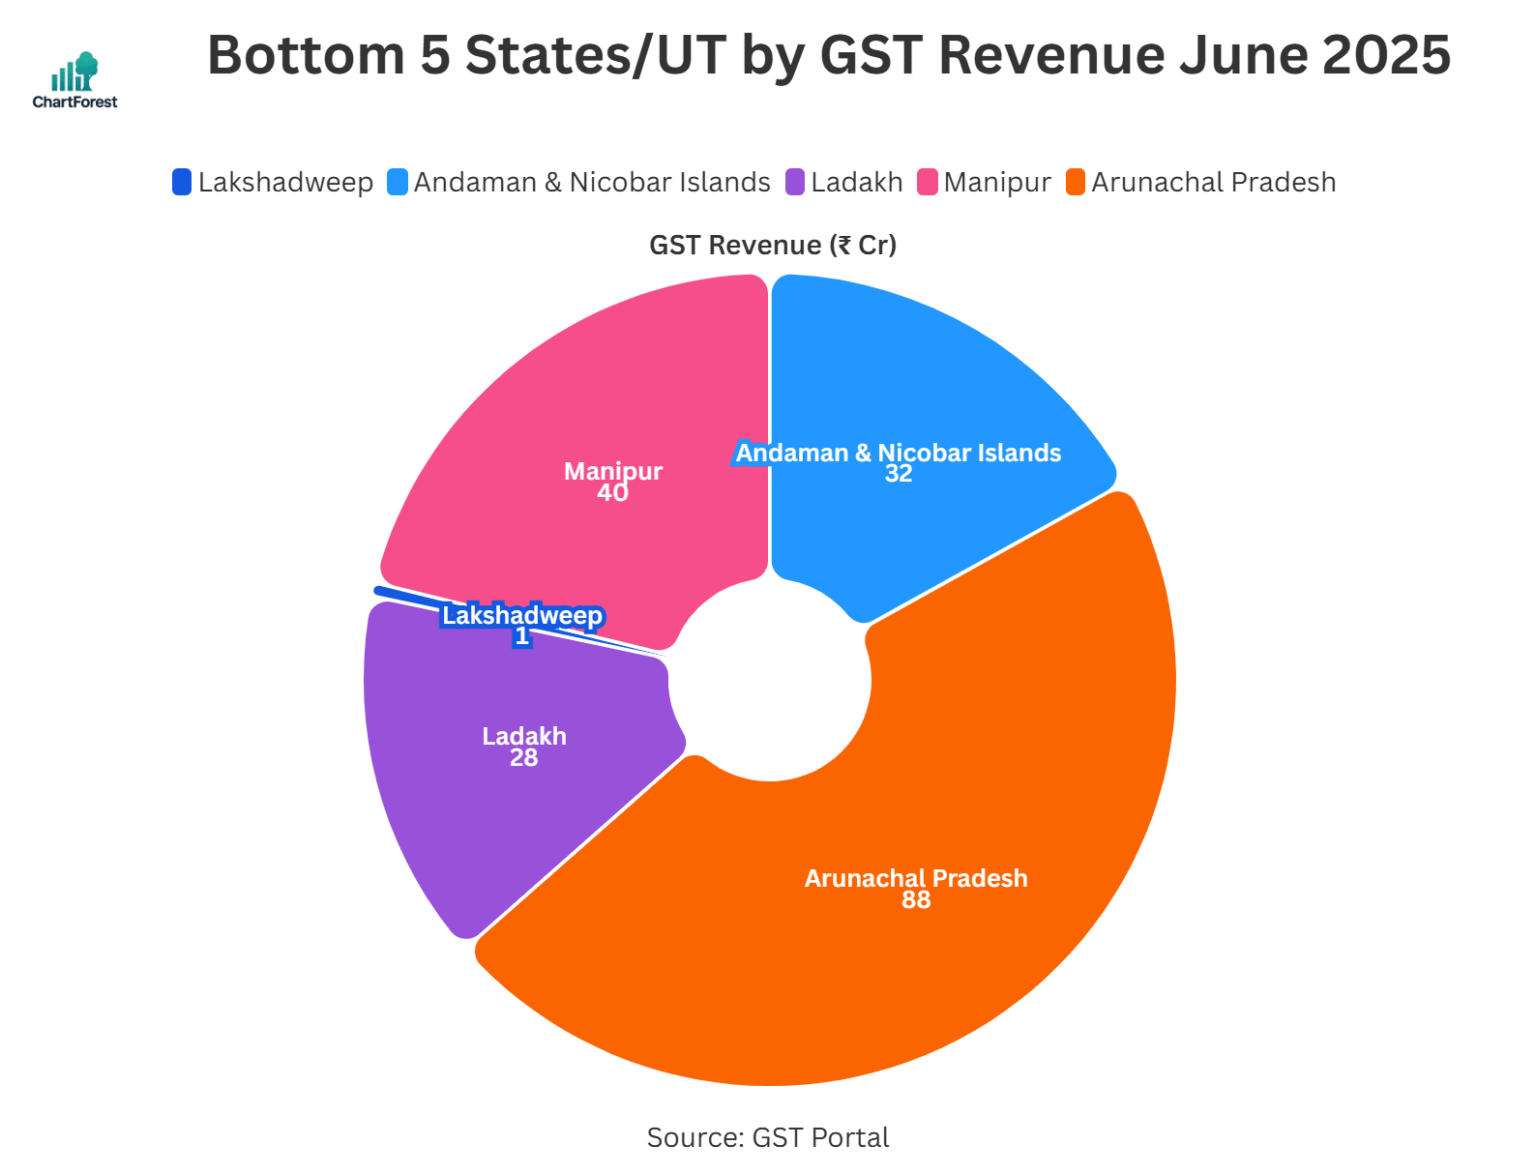
GST Revenue State/UT wise
Here is the chart and table containing the latest month’s GST revenue state-wise:
State-Wise GST Collections: Breakdown and Performance
| State/UT | June 2025 (₹ Cr) | June 2024 (₹ Cr) | YoY Change (%) | Notes |
|---|---|---|---|---|
| Jammu and Kashmir | 566 | 555 | 2% | Modest growth; stable collections |
| Himachal Pradesh | 902 | 886 | 2% | Stable collections |
| Punjab | 2,232 | 2,306 | -3% | Slight decline; likely due to industrial fluctuations |
| Chandigarh | 220 | 224 | -2% | Marginal drop; possibly reporting variation |
| Uttarakhand | 1,699 | 1,705 | 0% | Flat; industrial activity steady |
| Haryana | 9,959 | 9,038 | 10% | Solid industrial and consumption activity |
| Delhi | 5,610 | 5,289 | 6% | Healthy services and retail base |
| Rajasthan | 4,522 | 4,254 | 6% | Steady growth; infrastructure demand |
| Uttar Pradesh | 9,248 | 9,601 | -4% | Slight decline; mature tax base |
| Bihar | 1,709 | 1,525 | 12% | Strong compliance-driven growth |
| Sikkim | 364 | 318 | 15% | Boost from tourism and hydropower |
| Arunachal Pradesh | 88 | 91 | -3% | Minor decline; low base effect |
| Nagaland | 84 | 49 | 71% | Very high jump; low base and better coverage |
| Manipur | 40 | 62 | -36% | Significant drop; possible compliance or economic dip |
| Mizoram | 30 | 42 | -29% | Steep decline; likely economic factors |
| Tripura | 87 | 74 | 18% | Good compliance-based growth |
| Meghalaya | 172 | 180 | -4% | Marginal dip; local fluctuations |
| Assam | 1,405 | 1,448 | -3% | Slight decline; possibly transitional |
| West Bengal | 5,551 | 5,273 | 5% | Steady growth; industrial base expanding |
| Jharkhand | 3,086 | 2,814 | 10% | Mining and industrial activity support |
| Odisha | 5,079 | 4,987 | 2% | Stable; strong mining base |
| Chhattisgarh | 3,276 | 3,178 | 3% | Modest growth; steady performance |
| Madhya Pradesh | 3,889 | 3,631 | 7% | Consistent industrial and consumption-driven growth |
| Gujarat | 11,040 | 11,102 | -1% | Slight decline; high base impact |
| Dadra & Nagar Haveli & Daman Diu | 410 | 394 | 4% | Mild growth; industrial consistency |
| Maharashtra | 30,553 | 28,881 | 6% | Strong industrial and services demand |
| Karnataka | 13,409 | 12,389 | 8% | Good growth; IT and services continue to lead |
| Goa | 551 | 546 | 1% | Stable; tourism-led collections |
| Lakshadweep | 1 | 1 | 37% | High % rise on very low base |
| Kerala | 2,856 | 2,618 | 9% | Growth driven by tourism and consumption |
| Tamil Nadu | 10,676 | 10,218 | 4% | Moderate growth; industrial expansion |
| Puducherry | 241 | 243 | -1% | Slight decline; flat base |
| Andaman and Nicobar Islands | 32 | 31 | 3% | Stable; tourism support |
| Telangana | 5,111 | 4,716 | 8% | Healthy growth; IT & retail steady |
| Andhra Pradesh | 3,634 | 3,651 | 0% | Flat; possible industrial slowdown |
| Ladakh | 28 | 23 | 22% | High growth; low base effect |
| Other Territory | 228 | 207 | 10% | Compliance improvement |
| Center Jurisdiction | 317 | 249 | 27% | Notable rise; stronger enforcement/compliance |
| Grand Total | 1,38,906 | 1,32,800 | 4.60% | All-India growth moderate; domestic demand improving |
Note: This table does not include GST collection on the import of goods.
FAQs
What is GST?
The GST, or Goods and Services Tax, is a comprehensive indirect tax applied at multiple stages on the sale of goods and services throughout India, replacing several former taxes such as VAT, excise duty, and service tax, and is destination-based.
When was GST introduced in India?
GST was launched on 1st July 2017.
What are the types of GST in India?
Central GST (CGST) is imposed by the central government on supplies within the same state, while State GST (SGST) is charged by the state government on similar intra-state transactions. Conversely, Integrated GST (IGST) is administrated by the central government for supplies that cross state boundaries.
Can I operate in multiple states with one GST number?
No, you need a separate GSTIN for each state where you supply goods or services.
What is the GST Council?
This constitutional body proposes GST legislation, tax rates, exemptions, and methods for resolving disputes, with participation from representatives of both central and state governments.
What are the key benefits of implementing GST in India?
The introduction of GST in India has led to numerous notable advantages, including the establishment of a unified national market by merging many central and state taxes into one. This consolidation has diminished the cascading or double taxation effect, benefiting both businesses and the economy. Lower indirect tax rates enhance the competitiveness of Indian products both in domestic and international markets.
Related Indicators
Other Indicators
Monetary Policy & Banking Indicators
Inflation and Price Indicators
- Inflation Rate (%)
- Consumer Price Index (points)
- Wholesale Price Index (WPI)
- Food Inflation (CFPI)
- Health Inflation
- Education Inflation
- CPI Housing Utilities
- Inflation Expectations
Trade & External Sector Indicators
GST Reports & Analysis
Important
If you notice any discrepancies in the data or find any inaccuracies, please let us know. We will review and correct them as soon as possible.